
In this tutorial, you will learn how to install ELK Stack 8 on Ubuntu 24.04/22.04/20.04 systems.
Table of Contents
Installing ELK Stack on Ubuntu 24.04/22.04/20.04
Install Elastic 8 Repositories on Ubuntu
To ensure that you are installing the latest stable release version Elastic components, you need to install the Elastic repository on your system.
Thus, download and install the Elastic repository GPG signing key;
sudo apt updatesudo apt install gnupg2 apt-transport-https -ywget -qO - https://artifacts.elastic.co/GPG-KEY-elasticsearch \
| sudo gpg --dearmor -o /etc/apt/trusted.gpg.d/elasticsearch-keyring.gpgInstall Elastic APT repository;
echo "deb https://artifacts.elastic.co/packages/8.x/apt stable main"| \
sudo tee /etc/apt/sources.list.d/elk-8.list
Update the package cache;
sudo apt updateInstall Elasticsearch 8 on Ubuntu 24.04/22.04/20.04
You can install Elasticsearch 8 on Ubuntu by running the command below;
sudo apt install elasticsearch -yAs you might already know, Elastic Stack 8 comes with security enabled by default. This is evident by the Elasticsearch installation output. See example output below;
Setting up elasticsearch (8.12.2) ... --------------------------- Security autoconfiguration information ------------------------------ Authentication and authorization are enabled. TLS for the transport and HTTP layers is enabled and configured. The generated password for the elastic built-in superuser is : 0suaVvMm8cqBvtSDcqgE If this node should join an existing cluster, you can reconfigure this with '/usr/share/elasticsearch/bin/elasticsearch-reconfigure-node --enrollment-token' after creating an enrollment token on your existing cluster. You can complete the following actions at any time: Reset the password of the elastic built-in superuser with '/usr/share/elasticsearch/bin/elasticsearch-reset-password -u elastic'. Generate an enrollment token for Kibana instances with '/usr/share/elasticsearch/bin/elasticsearch-create-enrollment-token -s kibana'. Generate an enrollment token for Elasticsearch nodes with '/usr/share/elasticsearch/bin/elasticsearch-create-enrollment-token -s node'. ------------------------------------------------------------------------------------------------- ### NOT starting on installation, please execute the following statements to configure elasticsearch service to start automatically using systemd sudo systemctl daemon-reload sudo systemctl enable elasticsearch.service ### You can start elasticsearch service by executing sudo systemctl start elasticsearch.service
As you can see from the above;
- Authentication and authorization are enabled (password for elastic superadmin user is generated and printed to the output).
- TLS for the transport and HTTP layers is enabled and configured.
Configure Elasticsearch 8
By default, Elasticsearch configures itself as single-node cluster. So if you are running ELK stack on a single node, nothing much is needed for configurations.
In this tutorial, we are using ELK stack single node. We wont there delve into the cluster setup in this guide.
This is how the default Elasticsearch configuration looks like;
cat /etc/elasticsearch/elasticsearch.yml# ======================== Elasticsearch Configuration ========================= # # NOTE: Elasticsearch comes with reasonable defaults for most settings. # Before you set out to tweak and tune the configuration, make sure you # understand what are you trying to accomplish and the consequences. # # The primary way of configuring a node is via this file. This template lists # the most important settings you may want to configure for a production cluster. # # Please consult the documentation for further information on configuration options: # https://www.elastic.co/guide/en/elasticsearch/reference/index.html # # ---------------------------------- Cluster ----------------------------------- # # Use a descriptive name for your cluster: # #cluster.name: my-application # # ------------------------------------ Node ------------------------------------ # # Use a descriptive name for the node: # #node.name: node-1 # # Add custom attributes to the node: # #node.attr.rack: r1 # # ----------------------------------- Paths ------------------------------------ # # Path to directory where to store the data (separate multiple locations by comma): # path.data: /var/lib/elasticsearch # # Path to log files: # path.logs: /var/log/elasticsearch # # ----------------------------------- Memory ----------------------------------- # # Lock the memory on startup: # #bootstrap.memory_lock: true # # Make sure that the heap size is set to about half the memory available # on the system and that the owner of the process is allowed to use this # limit. # # Elasticsearch performs poorly when the system is swapping the memory. # # ---------------------------------- Network ----------------------------------- # # By default Elasticsearch is only accessible on localhost. Set a different # address here to expose this node on the network: # #network.host: 192.168.0.1 # # By default Elasticsearch listens for HTTP traffic on the first free port it # finds starting at 9200. Set a specific HTTP port here: # #http.port: 9200 # # For more information, consult the network module documentation. # # --------------------------------- Discovery ---------------------------------- # # Pass an initial list of hosts to perform discovery when this node is started: # The default list of hosts is ["127.0.0.1", "[::1]"] # #discovery.seed_hosts: ["host1", "host2"] # # Bootstrap the cluster using an initial set of master-eligible nodes: # #cluster.initial_master_nodes: ["node-1", "node-2"] # # For more information, consult the discovery and cluster formation module documentation. # # ---------------------------------- Various ----------------------------------- # # Allow wildcard deletion of indices: # #action.destructive_requires_name: false #----------------------- BEGIN SECURITY AUTO CONFIGURATION ----------------------- # # The following settings, TLS certificates, and keys have been automatically # generated to configure Elasticsearch security features on 22-03-2024 18:36:29 # # -------------------------------------------------------------------------------- # Enable security features xpack.security.enabled: true xpack.security.enrollment.enabled: true # Enable encryption for HTTP API client connections, such as Kibana, Logstash, and Agents xpack.security.http.ssl: enabled: true keystore.path: certs/http.p12 # Enable encryption and mutual authentication between cluster nodes xpack.security.transport.ssl: enabled: true verification_mode: certificate keystore.path: certs/transport.p12 truststore.path: certs/transport.p12 # Create a new cluster with the current node only # Additional nodes can still join the cluster later cluster.initial_master_nodes: ["noble-numbat"] # Allow HTTP API connections from anywhere # Connections are encrypted and require user authentication http.host: 0.0.0.0 # Allow other nodes to join the cluster from anywhere # Connections are encrypted and mutually authenticated #transport.host: 0.0.0.0 #----------------------- END SECURITY AUTO CONFIGURATION -------------------------
For a single-node cluster, the default configuration is enough to get you started.
However, you may need to adjust JVM heap size depending on your RAM size. It is usually recommended to let Elasticsearch to handle this anyway. Elasticsearch by default automatically sets the JVM heap size based on a node’s roles and total memory, which is recommend for most production environments.
In my demo server, i have 3GB of RAM and this is the current default JVM settings (you can only run the command below when Elasticsearch is up and running);
curl -k -XGET "https://localhost:9200/_cat/nodes?h=heap*&v" -u elastic --cacert /etc/elasticsearch/certs/http_ca.crtSample settings;
heap.current heap.percent heap.max
     505.2mb           33    1.4gb
so it is set to almost half my RAM. And so I updated JVM settings as follows;
echo -e "-Xms512M\n-Xmx512M" > /etc/elasticsearch/jvm.options.d/jvm.optionsAlso, configure Elasticsearch to listen on all interfaces. It is usually bound to loopback address by default;
sudo vim /etc/elasticsearch/elasticsearch.ymlThe setting to bind it to all interfaces is. Otherwise specify specific IP instead of 0.0.0.0.
network.host: 0.0.0.0That is just it. Save and exit the config file.
Start and enable Elasticsearch to run on boot;
sudo systemctl daemon-reloadsudo systemctl enable --now elasticsearch.serviceConfirm if all good;
curl -k -XGET https://localhost:9200 -u elastic --cacert /etc/elasticsearch/certs/http_ca.crtNote the credentials used here are for the elastic user created during Elasticsearch install and is available on the installation output;
Output;
Enter host password for user 'elastic':
{
  "name" : "noble-numbat",
  "cluster_name" : "elasticsearch",
  "cluster_uuid" : "ZwrFEO84SXKZsjrlsFQkVQ",
  "version" : {
    "number" : "8.12.2",
    "build_flavor" : "default",
    "build_type" : "deb",
    "build_hash" : "48a287ab9497e852de30327444b0809e55d46466",
    "build_date" : "2024-02-19T10:04:32.774273190Z",
    "build_snapshot" : false,
    "lucene_version" : "9.9.2",
    "minimum_wire_compatibility_version" : "7.17.0",
    "minimum_index_compatibility_version" : "7.0.0"
  },
  "tagline" : "You Know, for Search"
}
You can also check the status;
systemctl status elasticsearchYou can check Elasticsearch service logs as follows;
sudo journalctl -u elasticsearch -fInstall Kibana 8 on Ubuntu 24.04/22.04/20.04
Next, install Kibana;
sudo apt install kibanaSample install output;
Reading package lists... Done
Building dependency tree... Done
Reading state information... Done
The following NEW packages will be installed:
  kibana
0 upgraded, 1 newly installed, 0 to remove and 96 not upgraded.
Need to get 318 MB of archives.
After this operation, 929 MB of additional disk space will be used.
Get:1 https://artifacts.elastic.co/packages/8.x/apt stable/main amd64 kibana amd64 8.12.2 [318 MB]
Fetched 318 MB in 6s (51.1 MB/s)
Selecting previously unselected package kibana.
(Reading database ... 112616 files and directories currently installed.)
Preparing to unpack .../kibana_8.12.2_amd64.deb ...
Unpacking kibana (8.12.2) ...
Setting up kibana (8.12.2) ...
Creating kibana group... OK
Creating kibana user... OK
Kibana is currently running with legacy OpenSSL providers enabled! For details and instructions on how to disable see https://www.elastic.co/guide/en/kibana/8.12/production.html#openssl-legacy-provider
Created Kibana keystore in /etc/kibana/kibana.keystore
Scanning processes...
Scanning linux images...

Running kernel seems to be up-to-date.

No services need to be restarted.

No containers need to be restarted.

No user sessions are running outdated binaries.

No VM guests are running outdated hypervisor (qemu) binaries on this host.
Configure Kibana
The default settings with a single-node cluster is enough to get you up and running.
To allow external access to Kibana, you need to configure it to bind to non-loopback address by changing the value of the server.host.
sudo vim /etc/kibana/kibana.ymlserver.host: "192.168.56.124"Use your correct server IP address.
Save and exit the file.
Start Kibana and enable it run on system boot;
sudo systemctl enable --now kibanaCheck the status;
systemctl status kibana● kibana.service - Kibana
Loaded: loaded (/usr/lib/systemd/system/kibana.service; enabled; preset: enabled)
Active: active (running) since Fri 2024-03-22 19:07:39 UTC; 35s ago
Docs: https://www.elastic.co
Main PID: 3263 (node)
Tasks: 11 (limit: 9407)
Memory: 268.3M (peak: 329.3M)
CPU: 8.833s
CGroup: /system.slice/kibana.service
└─3263 /usr/share/kibana/bin/../node/bin/node /usr/share/kibana/bin/../src/cli/dist
Mar 22 19:07:46 noble-numbat kibana[3263]: [2024-03-22T19:07:46.156+00:00][INFO ][plugins-service] Plugin "securitySolutionServerless" is disabled.
Mar 22 19:07:46 noble-numbat kibana[3263]: [2024-03-22T19:07:46.156+00:00][INFO ][plugins-service] Plugin "serverless" is disabled.
Mar 22 19:07:46 noble-numbat kibana[3263]: [2024-03-22T19:07:46.156+00:00][INFO ][plugins-service] Plugin "serverlessObservability" is disabled.
Mar 22 19:07:46 noble-numbat kibana[3263]: [2024-03-22T19:07:46.156+00:00][INFO ][plugins-service] Plugin "serverlessSearch" is disabled.
Mar 22 19:07:46 noble-numbat kibana[3263]: [2024-03-22T19:07:46.496+00:00][INFO ][http.server.Preboot] http server running at http://192.168.56.124:5601
Mar 22 19:07:46 noble-numbat kibana[3263]: [2024-03-22T19:07:46.593+00:00][INFO ][plugins-system.preboot] Setting up [1] plugins: [interactiveSetup]
Mar 22 19:07:46 noble-numbat kibana[3263]: [2024-03-22T19:07:46.604+00:00][INFO ][preboot] "interactiveSetup" plugin is holding setup: Validating Elasticsearch connection c>
Mar 22 19:07:46 noble-numbat kibana[3263]: [2024-03-22T19:07:46.622+00:00][INFO ][root] Holding setup until preboot stage is completed.
Mar 22 19:07:46 noble-numbat kibana[3263]: i Kibana has not been configured.
Mar 22 19:07:46 noble-numbat kibana[3263]: Go to http://192.168.56.124:5601/?code=283920 to get started.
Generate Elasticsearch Kibana Enrollment token for secured Kibana connection;
/usr/share/elasticsearch/bin/elasticsearch-create-enrollment-token -s kibanaSample output;
eyJ2ZXIiOiI4LjEyLjIiLCJhZHIiOlsiMTAuMC4yLjE1OjkyMDAiXSwiZmdyIjoiMWVkNWZjMGExMzEyYzlkNTIxMDJjOTUyMDk2MzUwMTA5Yjg2Y2MwOTg1NzhiNWZiYzZjMjk0ZTFkMjRjZGU5MCIsImtleSI6IlgxeVRaNDRCZFEwRlJZelBOUHBvOmFpc2xYTmxYU19lWG1HRm1IRC1mN2cifQ==Access Kibana Web Interface
Kibana listens on port 5601 by default;
ss -altnp | grep :5601LISTEN 0 511 192.168.56.124:5601 0.0.0.0:* users:(("node",pid=4108,fd=18))To access and activate Kibana, there is a URL that is generated and written to Kibana logs when Kibana is started. You can check as follows or even from the status command above;
sudo journalctl -u kibana -fMar 22 19:07:46 noble-numbat kibana[3263]: [2024-03-22T19:07:46.156+00:00][INFO ][plugins-service] Plugin "securitySolutionServerless" is disabled. Mar 22 19:07:46 noble-numbat kibana[3263]: [2024-03-22T19:07:46.156+00:00][INFO ][plugins-service] Plugin "serverless" is disabled. Mar 22 19:07:46 noble-numbat kibana[3263]: [2024-03-22T19:07:46.156+00:00][INFO ][plugins-service] Plugin "serverlessObservability" is disabled. Mar 22 19:07:46 noble-numbat kibana[3263]: [2024-03-22T19:07:46.156+00:00][INFO ][plugins-service] Plugin "serverlessSearch" is disabled. Mar 22 19:07:46 noble-numbat kibana[3263]: [2024-03-22T19:07:46.496+00:00][INFO ][http.server.Preboot] http server running at http://192.168.56.124:5601 Mar 22 19:07:46 noble-numbat kibana[3263]: [2024-03-22T19:07:46.593+00:00][INFO ][plugins-system.preboot] Setting up [1] plugins: [interactiveSetup] Mar 22 19:07:46 noble-numbat kibana[3263]: [2024-03-22T19:07:46.604+00:00][INFO ][preboot] "interactiveSetup" plugin is holding setup: Validating Elasticsearch connection configuration… Mar 22 19:07:46 noble-numbat kibana[3263]: [2024-03-22T19:07:46.622+00:00][INFO ][root] Holding setup until preboot stage is completed. Mar 22 19:07:46 noble-numbat kibana[3263]: i Kibana has not been configured. Mar 22 19:07:46 noble-numbat kibana[3263]: Go to http://192.168.56.124:5601/?code=283920 to get started.
Pay attention to line; Go to http://192.168.56.121:5601/?code=283920
You need to access the URL from the browser.
Hence, open the port on Firewall;
ufw allow 5601/tcpOr
iptables -A INPUT -p tcp --dport 5601 -j ACCEPTBe sure to save the rules.
Then access Kibana address given;
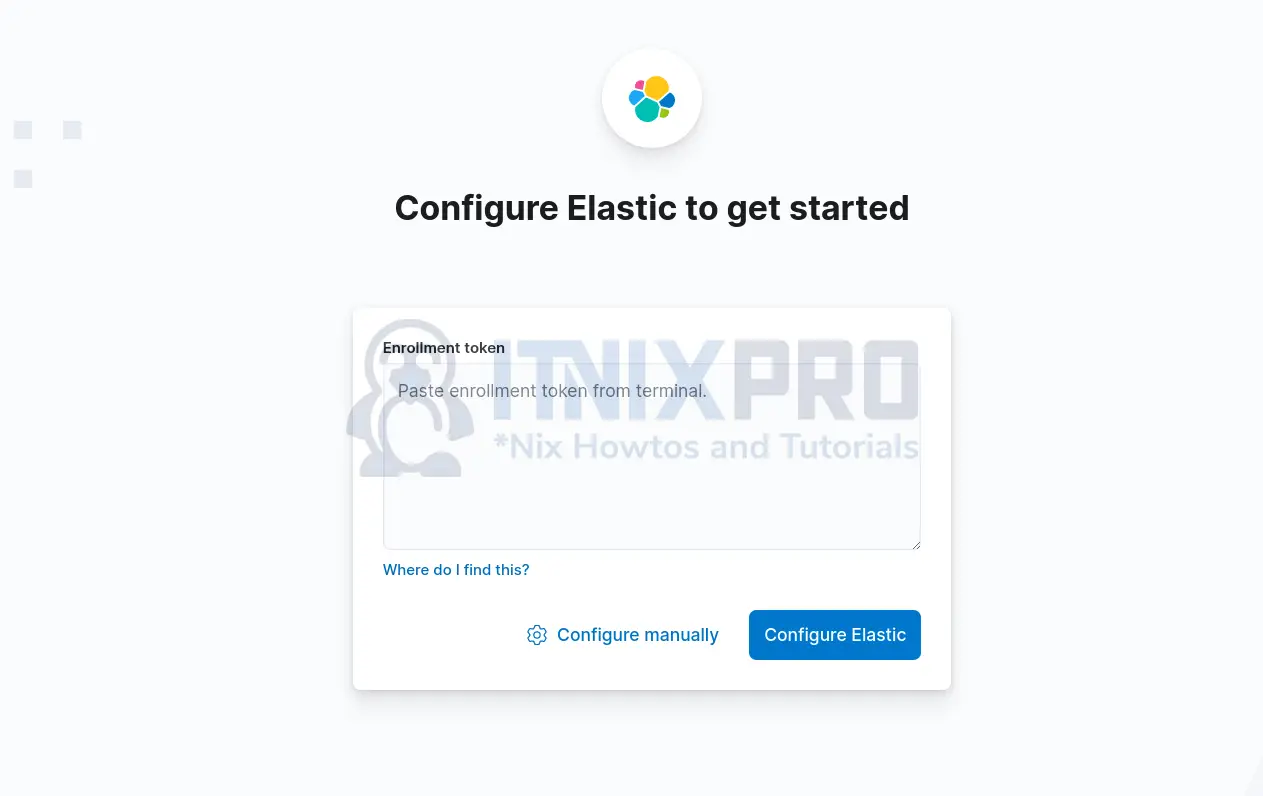
Paste the enrollment token generated above and click Configure Elastic.
After that, you maybe prompted to provide the verification code. Therefore, copy the configuration verification code from address, http://192.168.56.124:5601/?code=283920
Or you can simply run the command below to get the code;
/usr/share/kibana/bin/kibana-verification-codeYour verification code is: 283 920Enter the code and verify;
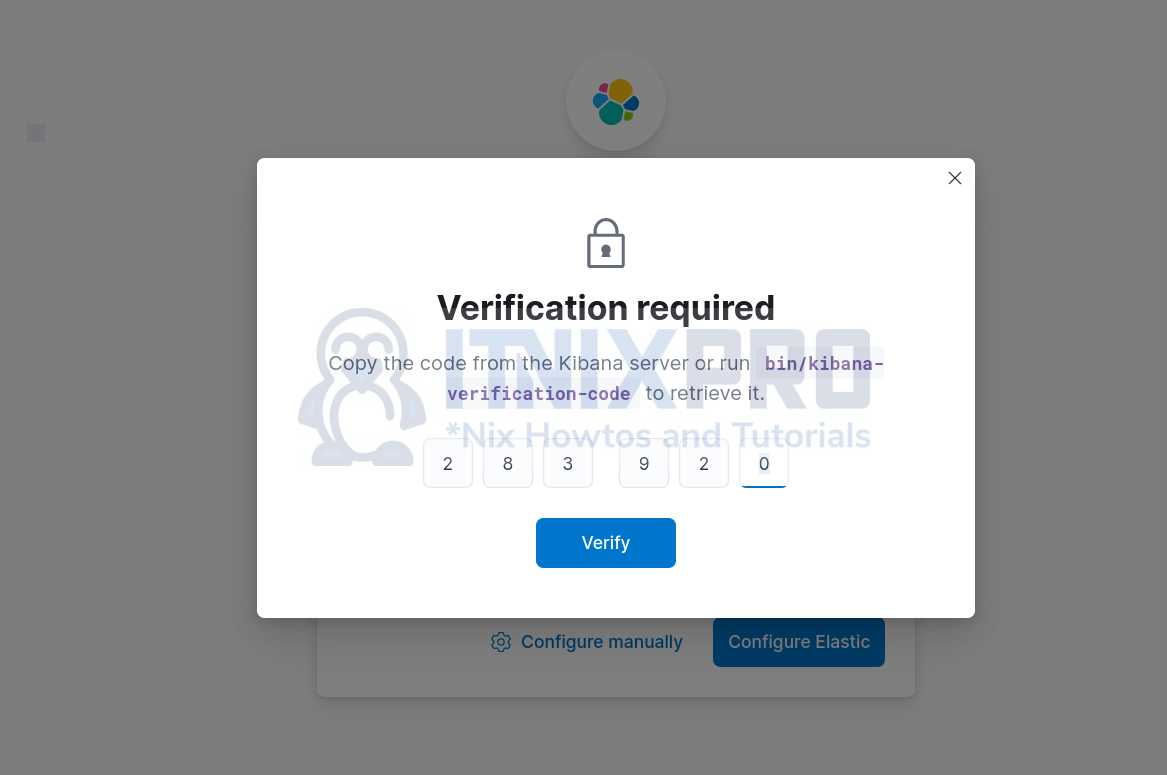
Click Verify.
If it fails with, Couldn’t configure Elastic, you can manually configure it by clicking Configure manually.
To proceed with manual configuration, first generate the kibana_system user password. This is the user that Kibana uses to connect and communicate with Elasticsearch.
/usr/share/elasticsearch/bin/elasticsearch-reset-password -u kibana_systemSample output;
This tool will reset the password of the [kibana_system] user to an autogenerated value.
The password will be printed in the console.
Please confirm that you would like to continue [y/N]y


Password for the [kibana_system] user successfully reset.
New value: +v*Kg1CYFH+dxDvtV+0a
Next, click Configure manually and enter Elasticsearch address;
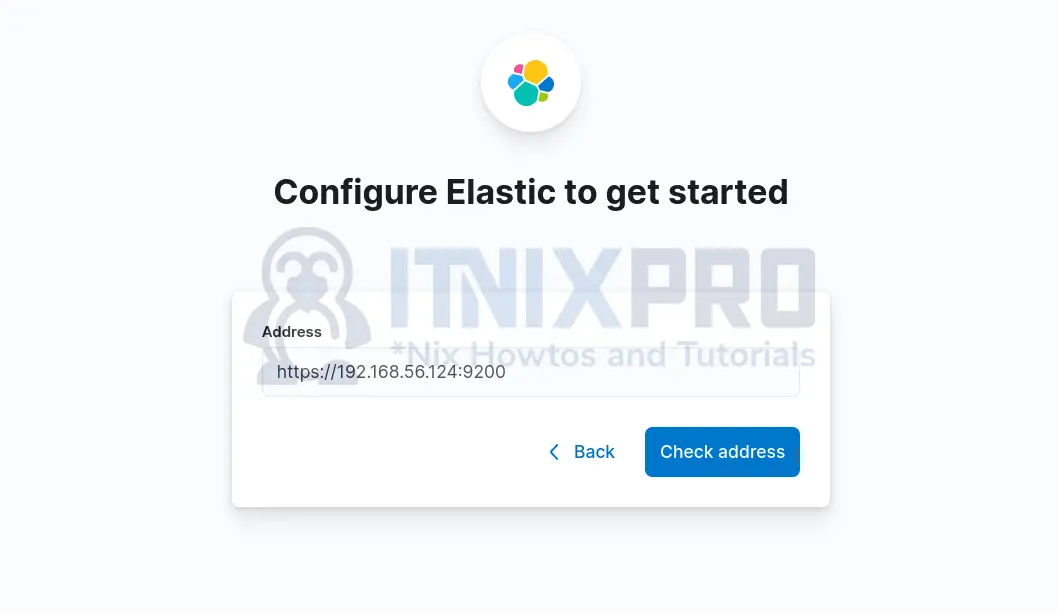
Check address to confirm connectivity.
Enter Kibana system user password and confirm that you recognize the certificate.
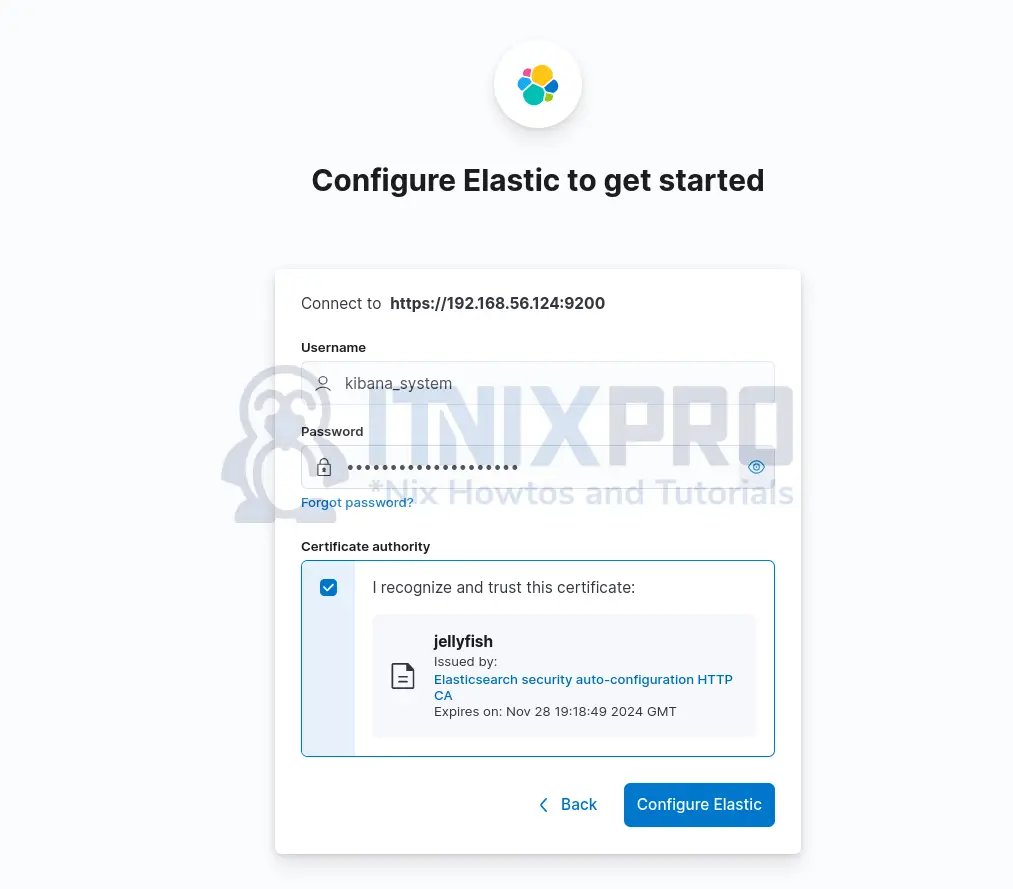
Again Configure Elastic and re-enter the verification code. You might want to retrieve it again using the command, /usr/share/kibana/bin/kibana-verification-code.
If all is good, Kibana-Elasticsearch connection is established and you are taken to login page.
Login as elastic super-admin user.
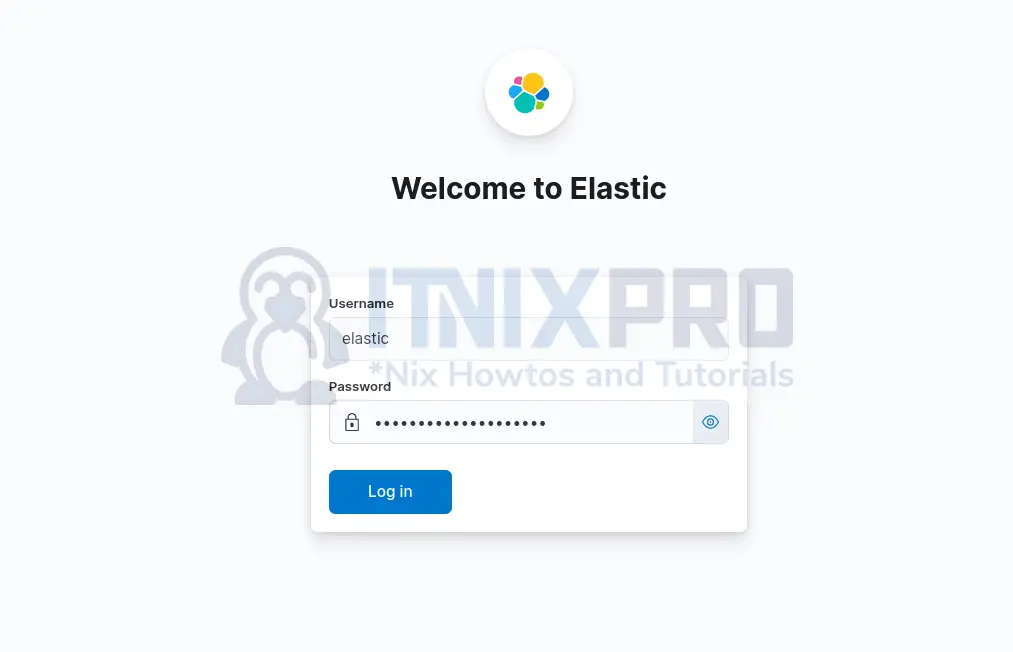
And there you go.
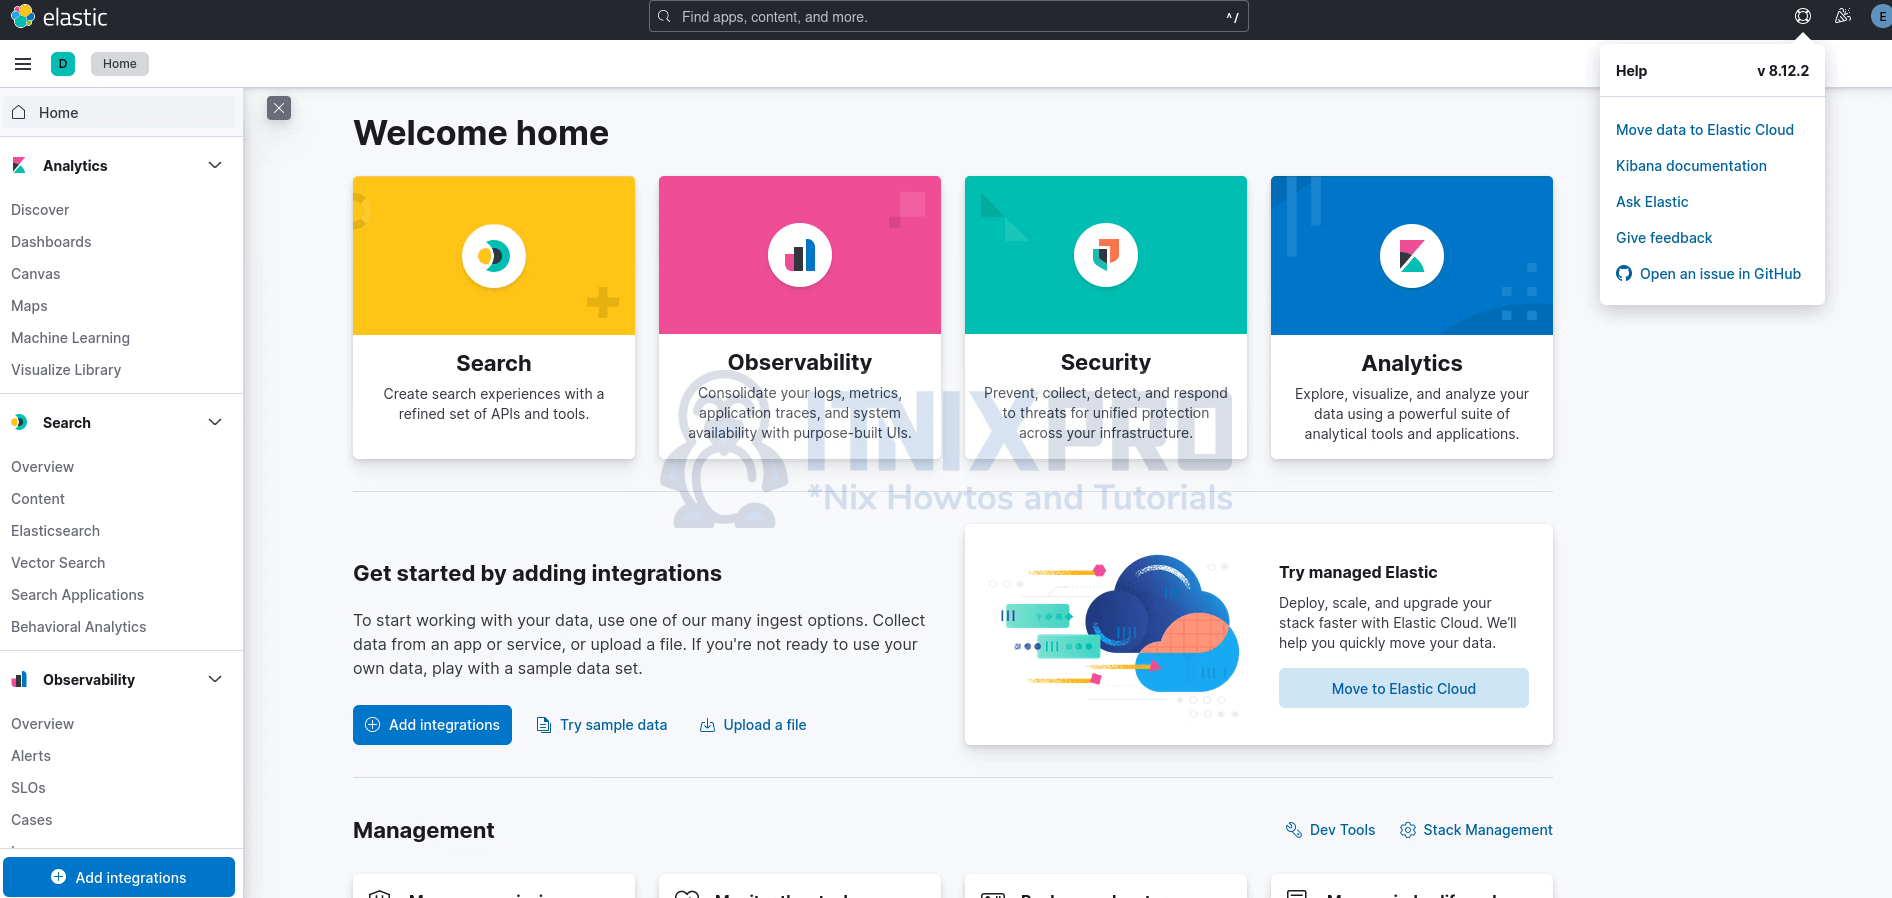
And there you go.
Install Logstash 8 on Ubuntu 24.04/22.04/20.04
Logstash component is optional and you can only use it if you require custom processing/parsing if your logs.
If you have the Elastic APT repository in place, simply run the command below to install Logstash 8. Please note that all Elastic components need to be of the same version for smooth operation.
sudo apt install logstashYou can see how to configure Logstash by following our previous guide.
How to Install Logstash on Debian
Installing Elastic Beats
Proceed to install beats to collect logs and push them into ELK stack.
Seem sample guide.
Install Filebeat 8 on Rocky Linux
That closes our guide on how to install ELK Stack 8 on Ubuntu 24.04/Ubuntu 22.04/Ubuntu 20.04.
Other Tutorials
Monitor HAProxy Logs with ELK Stack