
In this tutorial, you will learn how to install Wazuh server with ELK stack on Debian 11. Wazuh is a free, open source and enterprise-ready security monitoring solution for threat detection, integrity monitoring, incident response and compliance. It helps you to gain security visibility into your infrastructure by monitoring hosts at an operating system and application level.
Wazuh server is integrated with other tools such as ELK stack which provides users with better visualization of the event data as well easily search through the security event data.
Wazuh provides capabilities such as;
- Security Analytics.
- Intrusion Detection.
- Log Data Analysis.
- File Integrity Monitoring.
- Vulnerability Detection.
- Configuration Assessment.
- Incident Response.
- Regulatory Compliance.
- Cloud security
- Containers security.
Read more about these features on Wazuh documentation page.
Want to learn how to build mesmerizing visualizations, analytics, and logs from your data using Elasticsearch, Logstash, and Kibana? Check the link below;
Install Wazuh server with ELK stack on Debian 11
There are different deployment architectures for Wazuh server:
All-in-one deployment– Wazuh and the ELK stack components are installed on a single server.Multi-node (Distributed) deployment– Wazuh and ELK stack components are installed on separate nodes.
In this setup, just for demo purposes, we will be running Wazuh server on a single node. We will install both Wazuh server and ELK stack components on the same node.
You can check the requirements page before you can proceed.
Install Wazuh Server on Debian 11
In order to install and setup Wazuh server on Debian 11, there are two components that needs to be installed.
Install Wazuh Manager on Debian 11
Create Wazuh Repository
Debian 11 do not have Wazuh manager package on its repository list. As such you need to install Wazuh repository as follows;
Install some required packages;
apt install curl apt-transport-https unzip wget libcap2-bin software-properties-common lsb-release gnupg2
Install Wazuh repository GPG key;
curl -s https://packages.wazuh.com/key/GPG-KEY-WAZUH | gpg --dearmor > /etc/apt/trusted.gpg.d/wazuh.gpgInstall the Wazuh 4.x repository (current stable release as of this writing is v4.2.1);
echo "deb https://packages.wazuh.com/4.x/apt stable main" | tee /etc/apt/sources.list.d/wazuh.listUpdate the package information:
apt update
Check the available version of Wazuh manager;
apt-cache policy wazuh-manager
wazuh-manager:
  Installed: (none)
  Candidate: 4.2.1-1
  Version table:
     4.2.1-1 500
        500 https://packages.wazuh.com/4.x/apt stable/main amd64 Packages
     4.2.0-1 500
        500 https://packages.wazuh.com/4.x/apt stable/main amd64 Packages
     4.1.5-1 500
        500 https://packages.wazuh.com/4.x/apt stable/main amd64 Packages
...
As you can see, Wazuh manager 4.2.1-1 is the current release as provided by the repos.
Therefore, Install Wazuh Manager on Debian 11 by running the command below;
apt install wazuh-manager
Running Wazuh manager
Once the installation is done, run the command below to start and enable it to run on system boot;
systemctl enable --now wazuh-manager
Checking the status;
systemctl status wazuh-manager
● wazuh-manager.service - Wazuh manager
     Loaded: loaded (/lib/systemd/system/wazuh-manager.service; enabled; vendor preset: enabled)
     Active: active (running) since Mon 2021-09-13 23:16:55 EAT; 2s ago
    Process: 37732 ExecStart=/usr/bin/env /var/ossec/bin/wazuh-control start (code=exited, status=0/SUCCESS)
      Tasks: 100 (limit: 4679)
     Memory: 160.7M
        CPU: 15.731s
     CGroup: /system.slice/wazuh-manager.service
             ├─37890 /var/ossec/framework/python/bin/python3 /var/ossec/api/scripts/wazuh-apid.py
             ├─37930 /var/ossec/bin/wazuh-authd
             ├─37946 /var/ossec/bin/wazuh-db
             ├─37969 /var/ossec/bin/wazuh-execd
             ├─37983 /var/ossec/bin/wazuh-analysisd
             ├─38026 /var/ossec/bin/wazuh-syscheckd
             ├─38044 /var/ossec/bin/wazuh-remoted
             ├─38069 /var/ossec/bin/wazuh-logcollector
             ├─38082 /var/ossec/bin/wazuh-monitord
             ├─38101 /var/ossec/bin/wazuh-modulesd
             ├─38200 sh -c journalctl | grep "protection: active"
             ├─38202 journalctl
             └─38203 grep protection: active

Sep 13 23:16:46 debian11 env[37732]: Started wazuh-db...
Sep 13 23:16:47 debian11 env[37732]: Started wazuh-execd...
Sep 13 23:16:48 debian11 env[37732]: Started wazuh-analysisd...
Sep 13 23:16:49 debian11 env[37732]: Started wazuh-syscheckd...
Sep 13 23:16:50 debian11 env[37732]: Started wazuh-remoted...
Sep 13 23:16:51 debian11 env[37732]: Started wazuh-logcollector...
Sep 13 23:16:52 debian11 env[37732]: Started wazuh-monitord...
Sep 13 23:16:53 debian11 env[37732]: Started wazuh-modulesd...
Sep 13 23:16:55 debian11 env[37732]: Completed.
Sep 13 23:16:55 debian11 systemd[1]: Started Wazuh manager.
Install ELK Stack on Debian 11
Since we are using a single node deployment architecture, we will install ELK stack as well on the same node.
As of this writing, Wazuh 4.2 supports ELK 7.11.2 as per the compatibility matrix.
Therefore, the installation commands below installs ELK stack v7.11.2 on Debian 11.
Install the ELK/Elastic APT repository
Install the ELK/Elastic repository to enable you install the stack components. Begin by importing the ELK stack repository PGP signing Key;
wget -qO - https://artifacts.elastic.co/GPG-KEY-elasticsearch | gpg --dearmor > /etc/apt/trusted.gpg.d/elastic.gpg
Install ELK APT repository on Ubuntu.
echo "deb https://artifacts.elastic.co/packages/7.x/apt stable main" | sudo tee /etc/apt/sources.list.d/elastic-7.x.list
Run system update to update the added repository;
apt update
Installing Elasticsearch
Note, since the installation is done from the ELK APT repositories, you will get the current latest and stable versions installed. However, we need version 7.11.2. Hence, use the command below to install ES v7.11.2.
apt install elasticsearch=7.11.2
You can list available versions of a package using the command;
apt list -a <package-name>
e.g
apt list -a elasticsearch
Configuring Elasticsearch
Once the installation is done, proceed to configure Elasticsearch. The default configuration file for Elasticsearch is /etc/elasticsearch/elasticsearch.yml.
Open the configuration file for editing using your preferred text editor;
vim /etc/elasticsearch/elasticsearch.yml
You can optionally set the name of the cluster or go with the default;
# ---------------------------------- Cluster -----------------------------------
...
cluster.name: wazuh-elk
For the network settings, we will the defaults since by default, it uses the loopback interface and port 9200/tcp, which is fine for our case as we will only be accessing Elasticsearch locally from the Wazuh server.
By default, Elasticsearch tries to discovers other nodes to form a cluster when started. Since we are running a single node cluster, you need to specify the same by inserting the line, discovery.type: single-node, under the Discovery section.
# --------------------------------- Discovery ----------------------------------
...
discovery.type: single-node
Save and exit the file.
Configure the JVM heap size and set it to about half the memory available on the system.
vim /etc/elasticsearch/jvm.options
...
# Xms represents the initial size of total heap space
# Xmx represents the maximum size of total heap space

-Xms512m
-Xmx512m
Save and exit the file.
There are other important Elasticsearch configuration settings you should consider, especially if you are taking it to production. Check the Import Elasticsearch Configuration page for more tips.
Running Elasticsearch
Once you are done with Elasticsearch configurations, start and enable Elasticsearch to run on system boot.
systemctl enable --now elasticsearch
Checking the status;
systemctl status elasticsearch
You can use curl to verify if all is well with Elasticsearch;
curl http://localhost:9200
{
  "name" : "debian11",
  "cluster_name" : "wazuh-elk",
  "cluster_uuid" : "R43E98NFQlKXGQw6WSOFQQ",
  "version" : {
    "number" : "7.11.2",
    "build_flavor" : "default",
    "build_type" : "deb",
    "build_hash" : "3e5a16cfec50876d20ea77b075070932c6464c7d",
    "build_date" : "2021-03-06T05:54:38.141101Z",
    "build_snapshot" : false,
    "lucene_version" : "8.7.0",
    "minimum_wire_compatibility_version" : "6.8.0",
    "minimum_index_compatibility_version" : "6.0.0-beta1"
  },
  "tagline" : "You Know, for Search"
}
Install and Configure Kibana
Install Kibana 7.11.2 by running the command;
apt install kibana=7.11.2
Once the installation is done, you can configure Kibana. The default configuration file for Kibana is /etc/kibana/kibana.yml. Open the file editing.
vim /etc/kibana/kibana.ymlThe default host and port settings configure Kibana to run on localhost:5601. We need to change, the host especially, to enable us to reach Kibana externally.
# Kibana is served by a back end server. This setting specifies the port to use.
# server.port: 5601
server.port: 5601
...
# To allow connections from remote users, set this parameter to a non-loopback address.
#server.host: "localhost"
server.host: "192.168.58.22"
Next, you need to configure how Kibana will connect to Elasticsearch. By default, as depicted by the setting below, Kibana can connect to Elasticsearch on loopback address, that is only if Elasticsearch is set to listen on the loopback interface.
# The URLs of the Elasticsearch instances to use for all your queries.
#elasticsearch.hosts: ["http://localhost:9200"]
Be sure to set the IP address if ES is set to listen on a non-loopback IP address.
In its basic setup, that is just enough for Kibana.
Save and exit the file.
Running Kibana
Now start and enable Kibana to run on system boot;
systemctl enable --now kibana
Check the status;
systemctl status kibana
Install Logstash and Filebeat
apt install logstash=1:7.11.2-1 filebeat=7.11.2
Filebeat will be used to ship event data from Wazuh to Elasticsearch.
Logstash is optional and is installed just in case you need to further process your event data before sending it to Elasticsearch.
Start and enable Filebeat to run on system boot;
systemctl daemon-reload
systemctl enable --now filebeat
Configuring Filebeat
Setup Filebeat configuration.
mv /etc/filebeat/filebeat.yml{,.bak}
cat > /etc/filebeat/filebeat.yml << EOL
# Wazuh - Filebeat configuration file
output.elasticsearch:
  hosts: ["127.0.0.1:9200"]
setup.template.json.enabled: true
setup.template.json.path: '/etc/filebeat/wazuh-template.json'
setup.template.json.name: 'wazuh'
setup.ilm.overwrite: true
setup.ilm.enabled: auto

filebeat.modules:
  - module: wazuh
    alerts:
      enabled: true
    archives:
      enabled: false
logging.level: info
logging.to_files: true
logging.files:
  path: /var/log/filebeat
  name: filebeat
  keepfiles: 7
  permissions: 0644
EOL
Save and exit the configuration file.
Test Filebeat connection to Elasticsearch
filebeat test output
elasticsearch: http://127.0.0.1:9200...
  parse url... OK
  connection...
    parse host... OK
    dns lookup... OK
    addresses: 127.0.0.1
    dial up... OK
  TLS... WARN secure connection disabled
  talk to server... OK
  version: 7.11.2
Install Filebeat Wazuh Module
Download and install Filebeat Wazuh module;
wget https://packages.wazuh.com/4.x/filebeat/wazuh-filebeat-0.1.tar.gz -P /tmp/
mkdir /usr/share/filebeat/module/wazuh
tar xzf /tmp/wazuh-filebeat-0.1.tar.gz -C /usr/share/filebeat/module/wazuh/ --strip-components=1
Load Wazuh Elasticsearch Index Template to Elasticsearch
Download and load the Wazuh Elasticsearch alerts index template.
curl -so /etc/filebeat/wazuh-template.json https://raw.githubusercontent.com/wazuh/wazuh/v4.2/extensions/elasticsearch/7.x/wazuh-template.json
Next, load the template;
filebeat setup --path.config /etc/filebeat --path.home /usr/share/filebeat --path.data /var/lib/filebeat --index-management -E setup.template.json.enabled=false
Restart filebeat;
systemctl restart filebeat
Install Wazuh App Kibana Plugin
You can now install Wazuh app Kibana plugin. Before you can proceed, ensure that you set the owner of the directories, /usr/share/kibana/optimize/ and /usr/share/kibana/plugins to kibana.
[ ! -d "/usr/share/kibana/{optimize,plugins,data}" ] && mkdir /usr/share/kibana/{optimize,plugins,data}chown -R kibana: /usr/share/kibana/{optimize,plugins,data}Navigate to Kibana home directory;
cd /usr/share/kibana
The install Wazuh App for Kibana 7.11.2;
sudo -u kibana bin/kibana-plugin install https://packages.wazuh.com/4.x/ui/kibana/wazuh_kibana-4.2.1_7.11.2-1.zip
Attempting to transfer from https://packages.wazuh.com/4.x/ui/kibana/wazuh_kibana-4.2.1_7.11.2-1.zip
Transferring 34385386 bytes....................
Transfer complete
Retrieving metadata from plugin archive
Extracting plugin archive
Extraction complete
Plugin installation complete
You can list installed plugins;
sudo -u kibana /usr/share/kibana/bin/kibana-plugin list
[email protected]Start Kibana;
systemctl enable --now kibana
Restart Elasticsearch and Wazuh-manager;
systemctl restart elasticsearch wazuh-manager
Once they are up, if you check the created indices, you should be able to see wazuh-alerts* index created;
curl -s localhost:9200/_cat/indices?v | grep wazuh
Accessing the Wazuh App on Kibana
Accessing Kibana Interface
Now that your ELK stack is running, you can access Kibana interface, http://<server-IP-or-resolvable-hostname>:5601.
Ensure that you open Port 5601/TCP on firewall, to allow external access to Kibana.
ufw allow 5601/tcp
When you land on Kibana Interface, navigate to the menu and scroll down to see the Wazuh App. See example screenshot below;
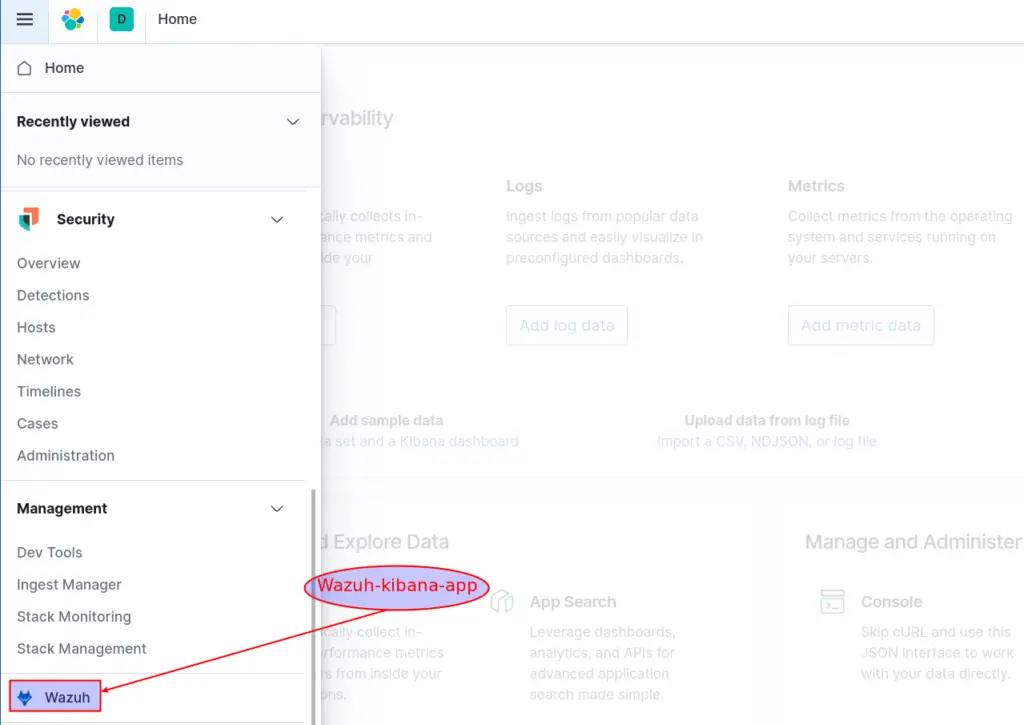

Upon clicking the app, it checks a few things like the Wazuh API connection and the version, the availability of the default indices such as wazuh-alerts-* (default index).
If all is well, you should land on the Wazuh dashboard;
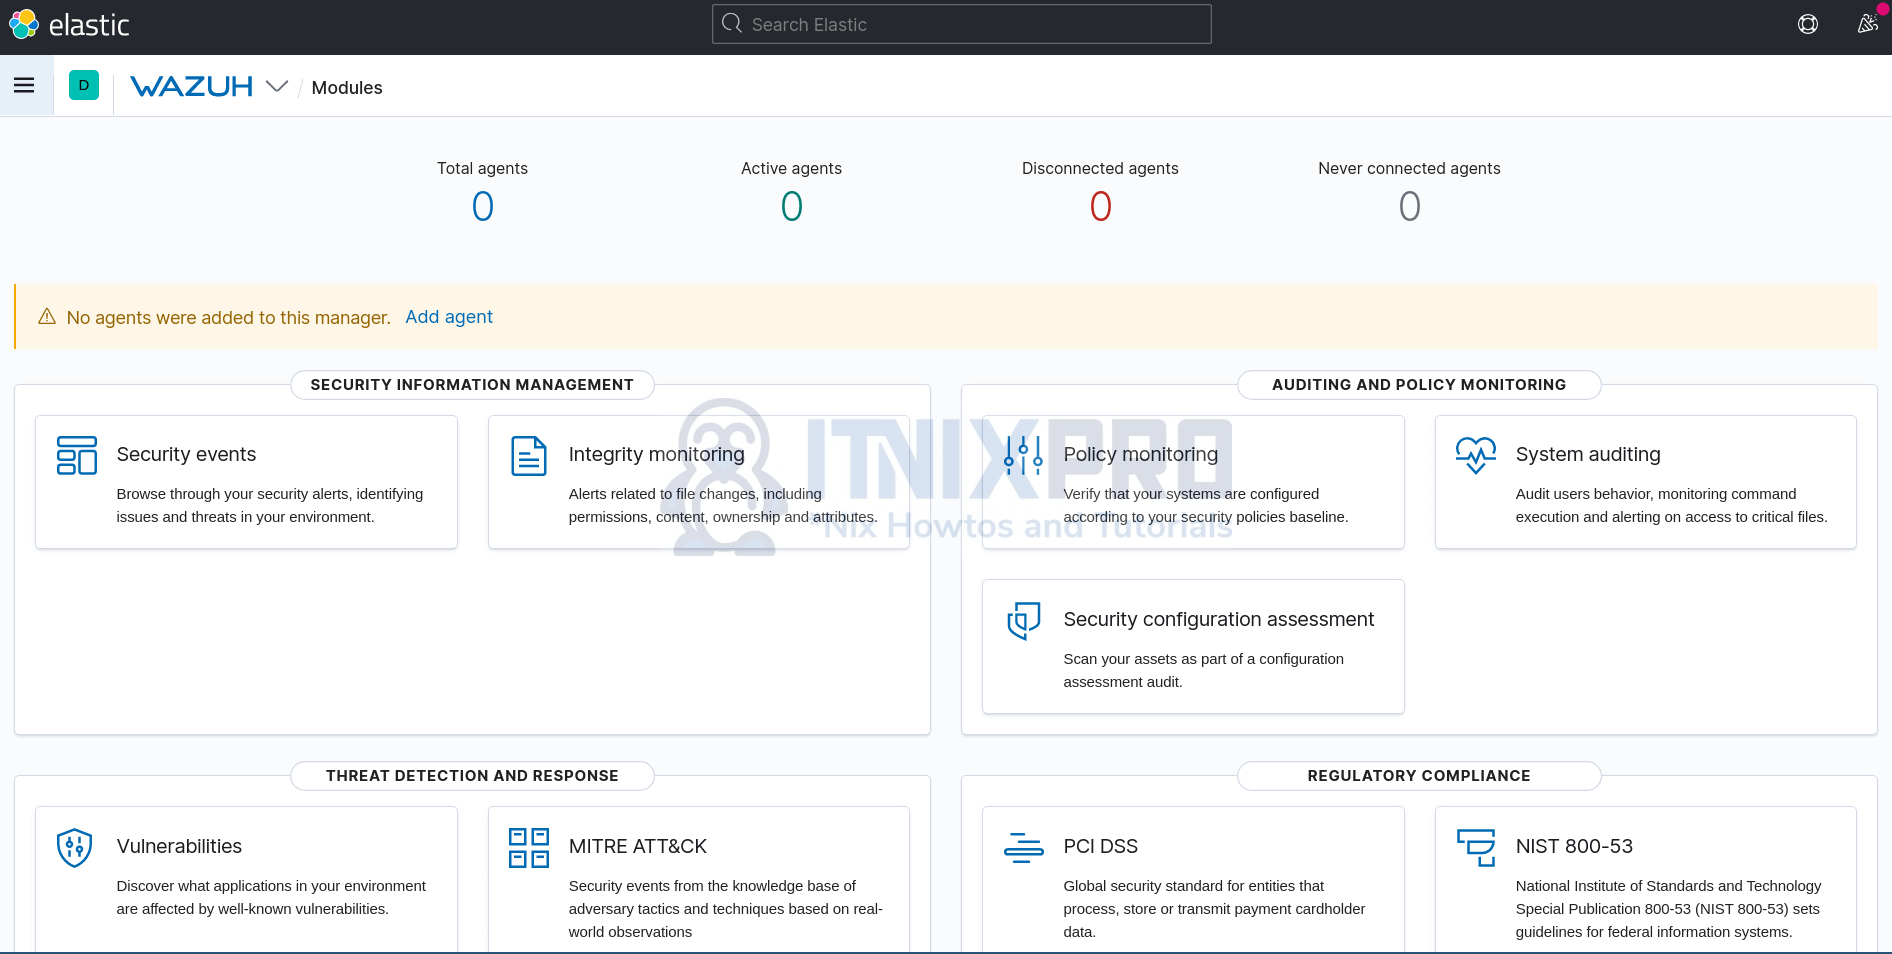
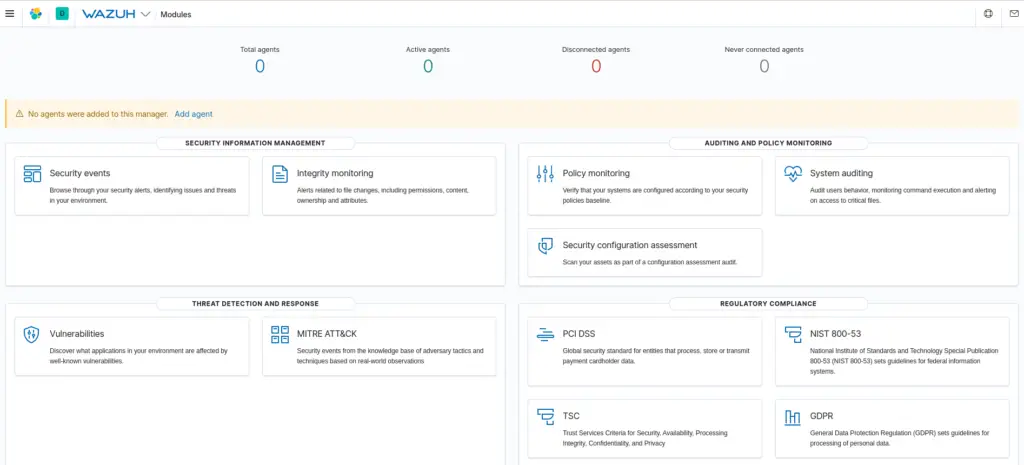
And that marks the end of our guide on how to install Wazuh server with ELK stack on Debian 11.
In our next guides, we will learn on how to install to and add Wazuh agents on end points being monitored to collect and ship data to Kibana for visualization.
Other Tutorials
Install Monitorix on Rocky Linux 8
ELK: Send Alerts when no data is received on an index
Install and Setup Wazuh Server with ELK Stack on Ubuntu 20.04