
In this tutorial, you will learn how to install and setup Wazuh server with ELK stack on Ubuntu 24.04 to gain a better security visibility into your infrastructure.
Table of Contents
How to Integrate Wazuh Server and ELK Stack
Install ELK Stack on Ubuntu 24.04
To integrate Wazuh server with ELK stack, you first need to have a running ELK stack. Remember that as from Wazuh 4.6, the Kibana Wazuh app is no longer supported. So you can either run Wazuh with Wazuh indexer and Wazuh dashboard, or sent the Wazuh server alerts to Logstash, when then process them and sent them over to Elasticsearch where you can then visualize on Kibana dashboards.
You can how to install ELK stack 8 on Ubuntu by following the link below;
Install ELK Stack 8 on Ubuntu 24.04/22.04/20.04
Installing Wazuh Server on Ubuntu 24.04/22.04
There are different deployment architectures for Wazuh server:
All-in-one deployment– Wazuh and the ELK stack components are installed on a single server.Multi-node (Distributed) deployment– Wazuh and ELK stack components are installed on separate nodes.
In this setup, just for demo purposes, we will be running Wazuh server on a single node. We will install both Wazuh server and ELK stack components on the same node.
So, in our single node deployment, we have the following components running on single system.
- Elasticsearch
- Kibana
- Logstash
- Wazuh server/manager
You can also choose to run Wazuh manager with Wazuh indexer then integrate Wazuh index with Logstash. Then Logstash can be integrated with Elasticsearch as usual.
Install Wazuh APT Repository on Ubuntu 24.04/Ubuntu 22.04
Ubuntu do not have Wazuh manager package on its repository list. As such you need to install Wazuh repository as follows;
Install some required packages;
sudo apt install curl apt-transport-https unzip wget libcap2-bin software-properties-common lsb-release gnupg2
Install Wazuh repository GPG key;
curl -s https://packages.wazuh.com/key/GPG-KEY-WAZUH | sudo gpg --dearmor -o /etc/apt/trusted.gpg.d/wazuh.gpg
Install the Wazuh 4.x repository (current stable release as of this writing is v4.7.x);
echo "deb https://packages.wazuh.com/4.x/apt stable main" | tee /etc/apt/sources.list.d/wazuh.list
Install Wazuh Server
Update the package information:
sudo apt update
Check the available version of Wazuh manager;
apt-cache policy wazuh-manager
wazuh-manager:
  Installed: (none)
  Candidate: 4.7.3-1
  Version table:
     4.7.3-1 500
        500 https://packages.wazuh.com/4.x/apt stable/main amd64 Packages
     4.7.2-1 500
        500 https://packages.wazuh.com/4.x/apt stable/main amd64 Packages
     4.7.1-1 500
        500 https://packages.wazuh.com/4.x/apt stable/main amd64 Packages
     4.7.0-1 500
        500 https://packages.wazuh.com/4.x/apt stable/main amd64 Packages
     4.6.0-4.5.tomaster 500
        500 https://packages.wazuh.com/4.x/apt stable/main amd64 Packages
     4.6.0-1 500
        500 https://packages.wazuh.com/4.x/apt stable/main amd64 Packages
...
As you can see, Wazuh manager 4.7.3-1 is the current release as provided by the repos. Therefore, Install Wazuh Manager, run the command below;
sudo apt install wazuh-manager
Running Wazuh manager
Once the installation is done, run the command below to start and enable it to run on system boot;
sudo systemctl enable --now wazuh-manager
Checking the status;
systemctl status wazuh-manager
● wazuh-manager.service - Wazuh manager
     Loaded: loaded (/usr/lib/systemd/system/wazuh-manager.service; enabled; preset: enabled)
     Active: active (running) since Fri 2024-03-22 20:42:47 UTC; 5s ago
    Process: 47652 ExecStart=/usr/bin/env /var/ossec/bin/wazuh-control start (code=exited, status=0/SUCCESS)
      Tasks: 140 (limit: 9407)
     Memory: 510.9M (peak: 511.6M)
        CPU: 17.385s
     CGroup: /system.slice/wazuh-manager.service
             ├─47708 /var/ossec/framework/python/bin/python3 /var/ossec/api/scripts/wazuh-apid.py
             ├─47747 /var/ossec/bin/wazuh-authd
             ├─47763 /var/ossec/bin/wazuh-db
             ├─47787 /var/ossec/bin/wazuh-execd
             ├─47798 /var/ossec/bin/wazuh-analysisd
             ├─47859 /var/ossec/bin/wazuh-syscheckd
             ├─47865 /var/ossec/framework/python/bin/python3 /var/ossec/api/scripts/wazuh-apid.py
             ├─47868 /var/ossec/framework/python/bin/python3 /var/ossec/api/scripts/wazuh-apid.py
             ├─47871 /var/ossec/framework/python/bin/python3 /var/ossec/api/scripts/wazuh-apid.py
             ├─47885 /var/ossec/bin/wazuh-remoted
             ├─47918 /var/ossec/bin/wazuh-logcollector
             ├─47956 /var/ossec/bin/wazuh-monitord
             ├─47967 /var/ossec/bin/wazuh-modulesd
             ├─48222 sh -c -- "/bin/ps -p 781 > /dev/null 2>&1"
             └─48223 /bin/ps -p 781

Mar 22 20:42:40 noble-numbat env[47652]: Started wazuh-db...
Mar 22 20:42:40 noble-numbat env[47652]: Started wazuh-execd...
Mar 22 20:42:41 noble-numbat env[47652]: Started wazuh-analysisd...
Mar 22 20:42:42 noble-numbat env[47652]: Started wazuh-syscheckd...
Mar 22 20:42:43 noble-numbat env[47652]: Started wazuh-remoted...
Mar 22 20:42:44 noble-numbat env[47652]: Started wazuh-logcollector...
Mar 22 20:42:44 noble-numbat env[47652]: Started wazuh-monitord...
Mar 22 20:42:45 noble-numbat env[47652]: Started wazuh-modulesd...
Mar 22 20:42:47 noble-numbat env[47652]: Completed.
Mar 22 20:42:47 noble-numbat systemd[1]: Started wazuh-manager.service - Wazuh manager.
Install and Configure Logstash
Install Logstash 8 on Ubuntu
In this tutorial, we will configure Wazuh server to sent Wazuh alerts to logstash for further processing and sent them over to Elasticsearch.
Check the guide below on how to install Logstash
Once Logstash is up and running, proceed with configuration.
Install Logstash Elasticsearch Output Plugin
To start with, you need to install Logstash Elasticsearch output plugin. This plugin will enable Logstash to store processed data in Elasticsearch engine.
The Logstash Elasticsearch output plugin can be installed by running the command below;
sudo /usr/share/logstash/bin/logstash-plugin install logstash-output-elasticsearchIf you want to list installed Logstash plugins, use the command;
sudo /usr/share/logstash/bin/logstash-plugin listRead more on;
sudo /usr/share/logstash/bin/logstash-plugin --helpCreate Wazuh Alerts Elasticsearch Index Template
Wazuh alerts Elasticsearch index template is required to ensure that Elasticsearch is able to create Wazuh index and map out the Wazuh alerts fields for proper indexing.
Wazuh provides a ready made template that you can simply download and configure Logstash output plugin to use when sending Wazuh alerts to Elasticsearch.
Download the index template using the command below;
sudo wget -qO /etc/logstash/wazuh-template.json https://packages.wazuh.com/integrations/elastic/4.x-8.x/dashboards/wz-es-4.x-8.x-template.jsonSo while configuring Logstash pipeline in the later steps, you can use template option in the Elasticsearch output section to define the path to the template above, /etc/logstash/wazuh-template.json.
Create Logstash Wazuh Alerts Pipeline
A logstash pipeline can be created by putting together the Logstash input, filter, output plugins in the same configuration file.
- The input plugin defines where Logstash will collect the event data to process from
- The filter plugin performs further processing of the event data such as field extraction and all that.
- Output plugin defines where to stash the data after being processed.
In our Logstash Wazuh alerts pipeline, we will only be having the input plugin, where we configure Logstash to read Wazuh alerts from the alerts file, /var/ossec/logs/alerts/alerts.json.
Thus, create Logstash Wazuh alerts pipeline as follows;
sudo vim /etc/logstash/conf.d/wazuh.confinput {
file {
id => "wazuh_alerts"
codec => "json"
start_position => "beginning"
stat_interval => "1 second"
path => "/var/ossec/logs/alerts/alerts.json"
mode => "tail"
ecs_compatibility => "disabled"
}
}
output {
elasticsearch {
hosts => "localhost:9200"
index => "wazuh-alerts-4.x-%{+YYYY.MM.dd}"
user => 'elastic'
password => 'password'
ssl => true
cacert => "/etc/logstash/http_ca.crt"
template => "/etc/logstash/wazuh-template.json"
template_name => "wazuh"
template_overwrite => true
}
}
Save and exit the file.
Read more about the input and output plugins used above.
In the output section:
- We are using localhost Elasticsearch since we are running a single node Wazuh-ELK and thus, both ES and Logstash running on the same node.
- Similarly, we have defined the username to use to write event data to Wazuh index. This is a super admin Elasticsearch user. I would recommend you use a less privileged user that has specific rights ONLY.
- You can also store the password using keystore. Read more on Logstash secrets keystore.
- The CA cert file used is the default Elasticsearch CA file, /etc/elasticsearch/certs/http_ca.crt, just copied to /etc/logstash/http_ca.crt.
Update Logstash Configurations Ownership/Permissions
For Logstash to be able to read the Wazuh alerts, you need to add the logstash user to the Wazuh group, wazuh.
sudo usermod -aG wazuh logstashAlso, ensure Logstash user owns the SSL CA file;
sudo chown logstash: /etc/logstash/http_ca.crtCheck Logstash Configuration for valid syntax
Confirm that the Logstash configuration is valid;
sudo -u logstash /usr/share/logstash/bin/logstash --path.settings /etc/logstash/ -tEnsure the output has, Configuration OK.
Running Logstash
You can now start and enable Logstash to run on system boot.
sudo systemctl enable --now logstashYou can check the status;
systemctl status logstashOr
Check the logs;
sudo journalctl -f -u logstashAccessing Kibana Interface
Now that your ELK stack , integrated with Wazuh server is running, you can access Kibana interface, http://<server-IP-or-resolvable-hostname>:5601.
Ensure that you open Port 5601/TCP on firewall, to allow external access to Kibana.
ufw allow 5601/tcp
Login using your credentials.
Kibana Interface:
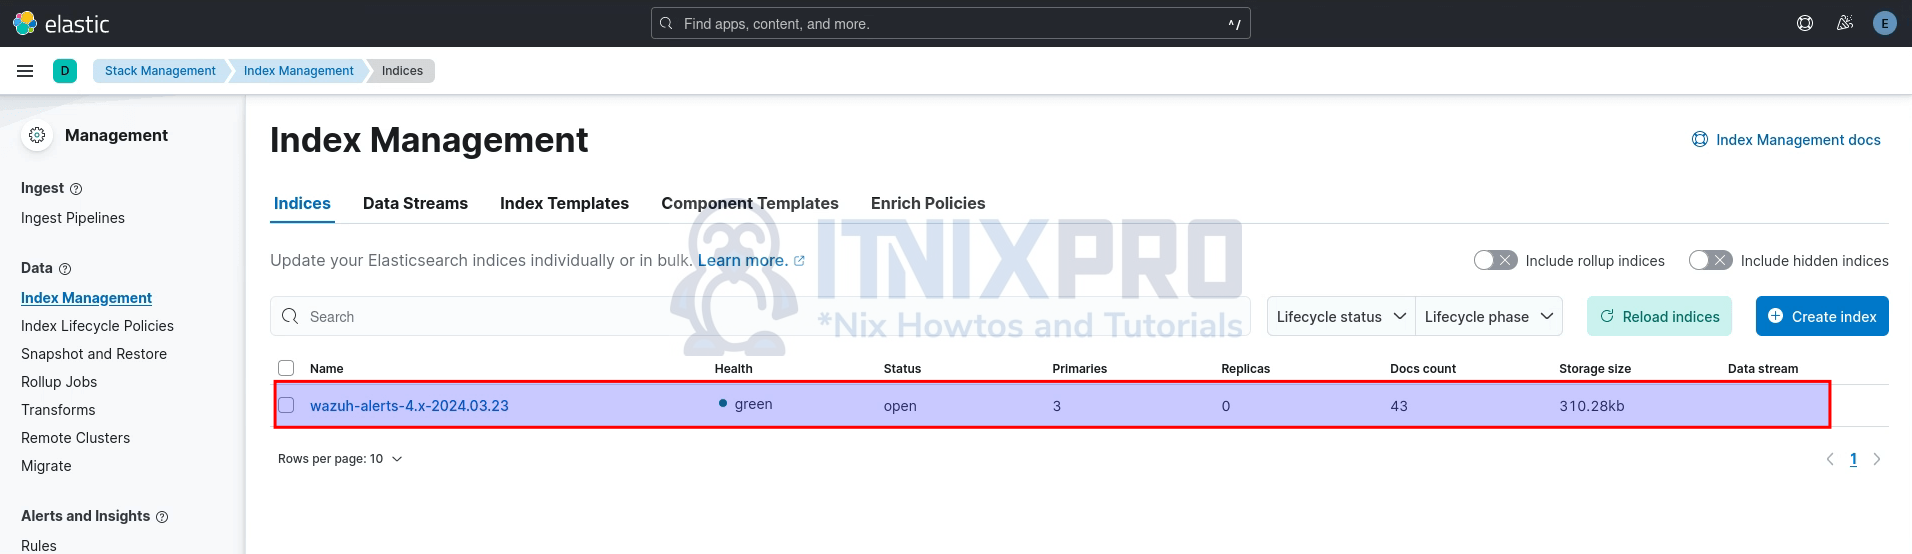
Check Wazuh Alerts Index Creation
Now that the integration of Wazuh server with ELK stack is done, you should be able to see the Wazuh alerts index created.
Thus, head over to Kibana management > Stack management > Data > Index management > indices.
And there you go!
Import Wazuh Alerts Visualization Dashboards
Now that you no longer have the Kibana Wazuh app to visualize the Wazuh agents data, Wazuh has developed some visualization dashboards for Elastic Stack that enables you query the Wazuh alerts index and visualize the data in there.
These dashboards/visualizations are installed by default. You have to download and manually import them.
You can download the dashboards JSON file to your system;
wget https://packages.wazuh.com/integrations/elastic/4.x-8.x/dashboards/wz-es-4.x-8.x-dashboards.ndjson -P ~/DesktopSee above, I just downloaded the file to my Desktop where I can easily access for importing into Kibana.
So, to import the Wazuh Elastic dashboards:
- head over to Kibana management > Stack management > Kibana > Saved Objects:
- Click on the Import button
- Select file to import, choose the file downloaded above
- Define import options
- Import the dashboards.
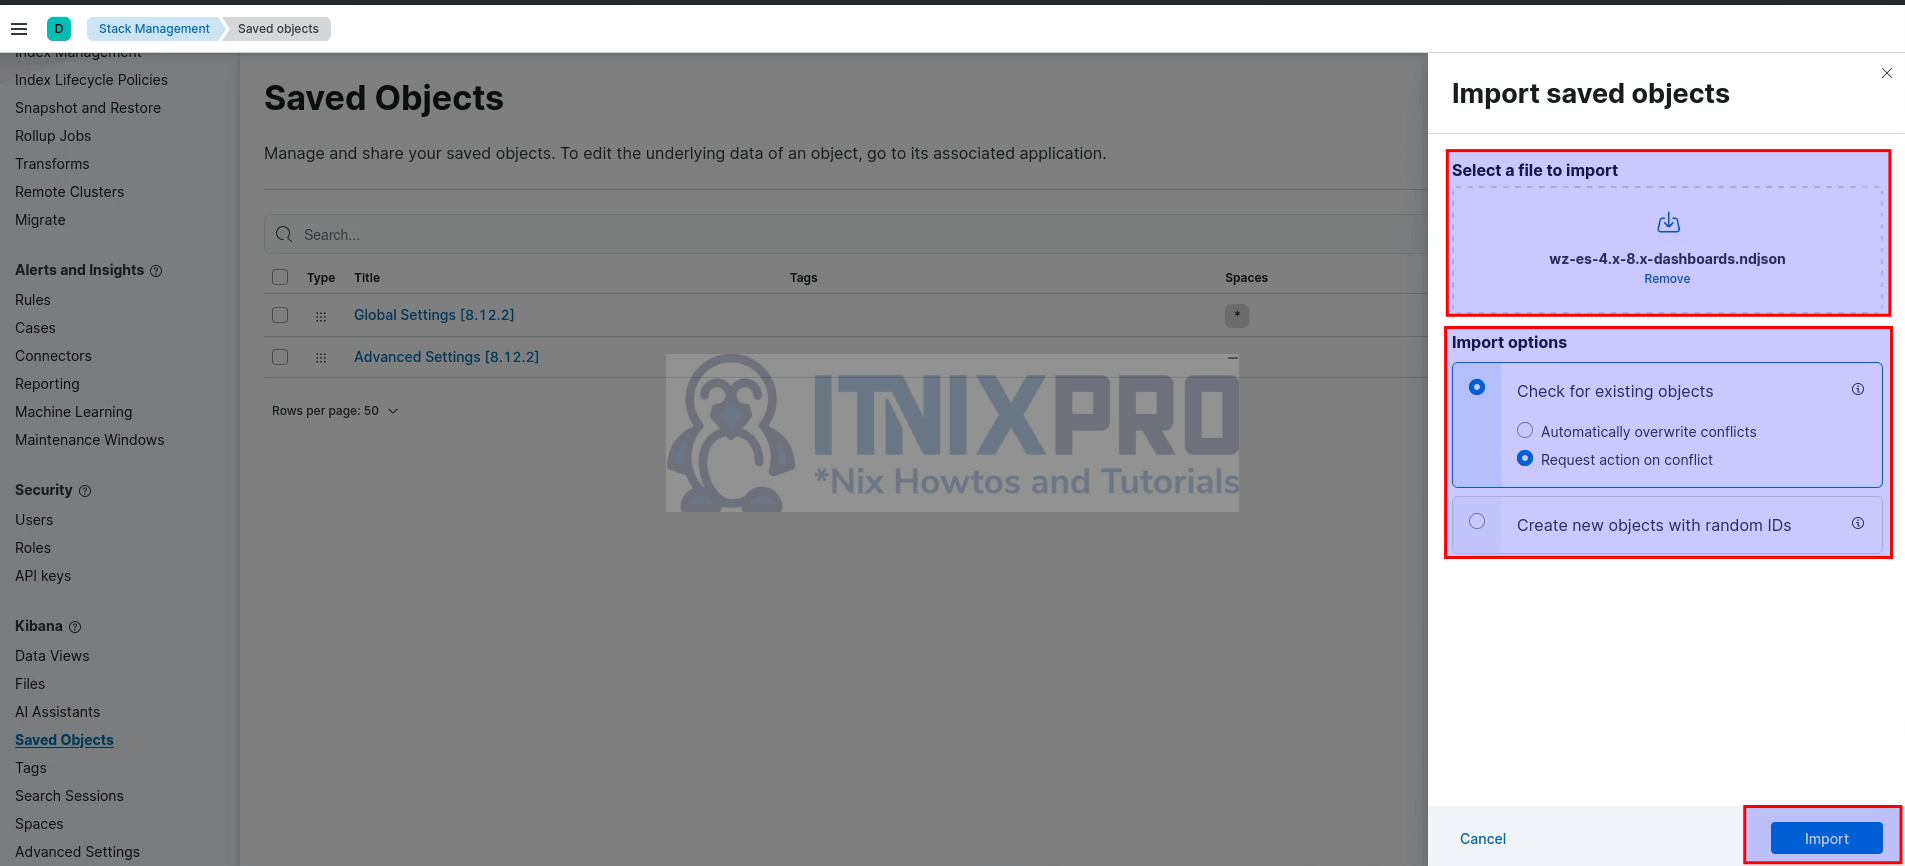
- Click Done, when Done importing.
You should now see the dashboards and Kibana index pattern (wazuh-alerts-4.x-*) populated to Saved Objects.
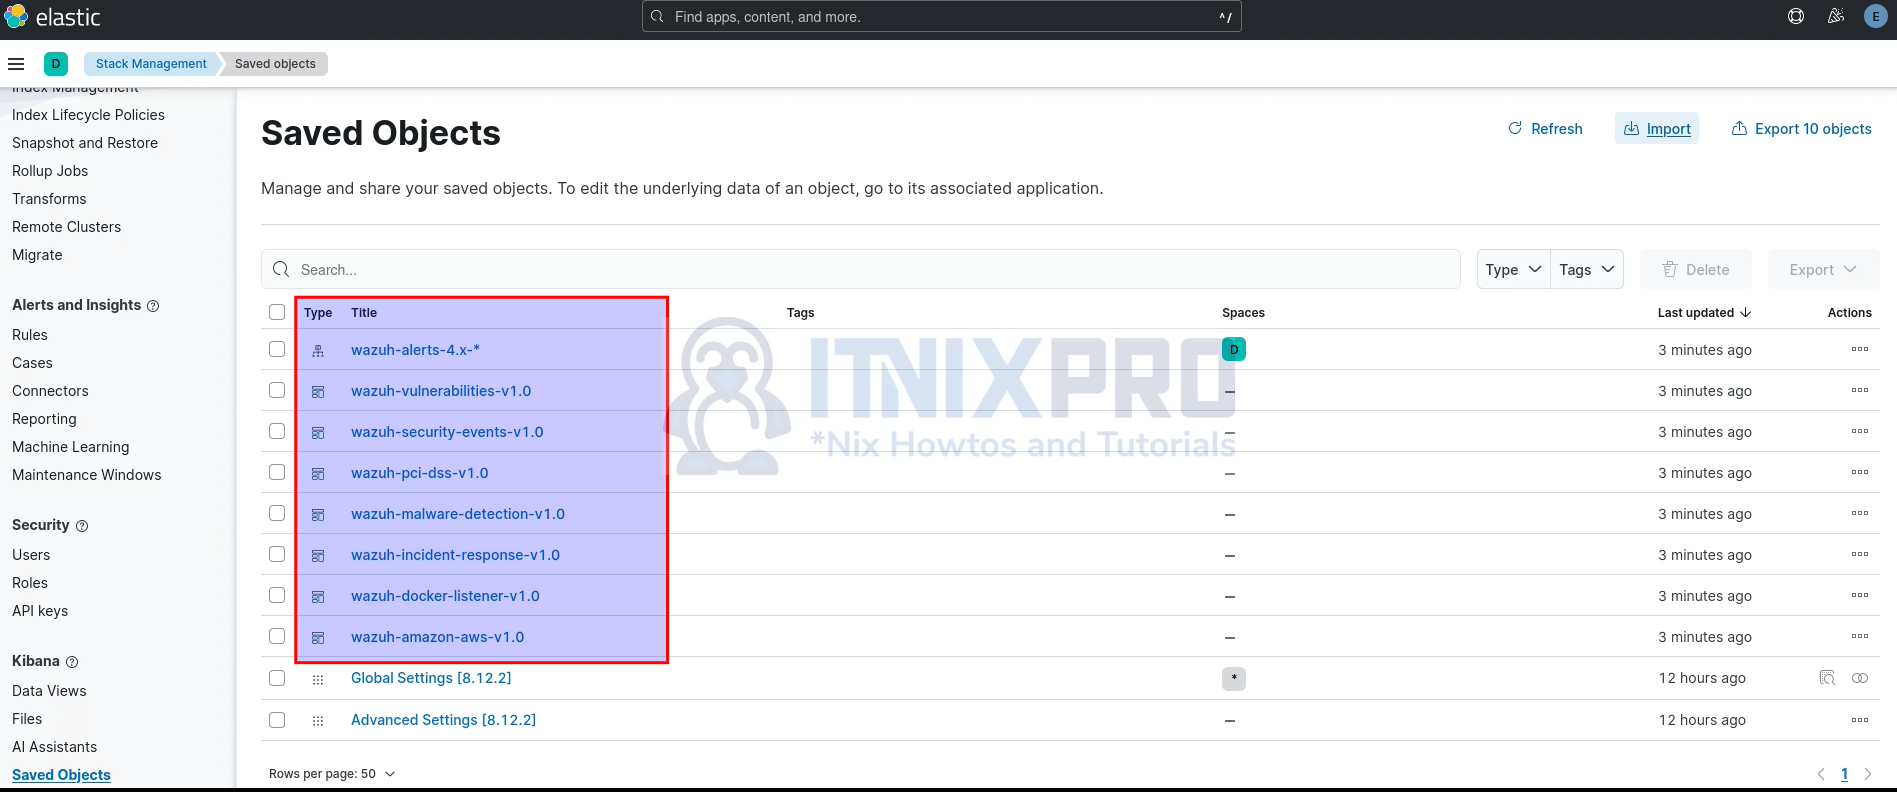
You should also be able to view them from Analytics > Dashboards.
You can check them out. See sample visualization of security events dashboard.
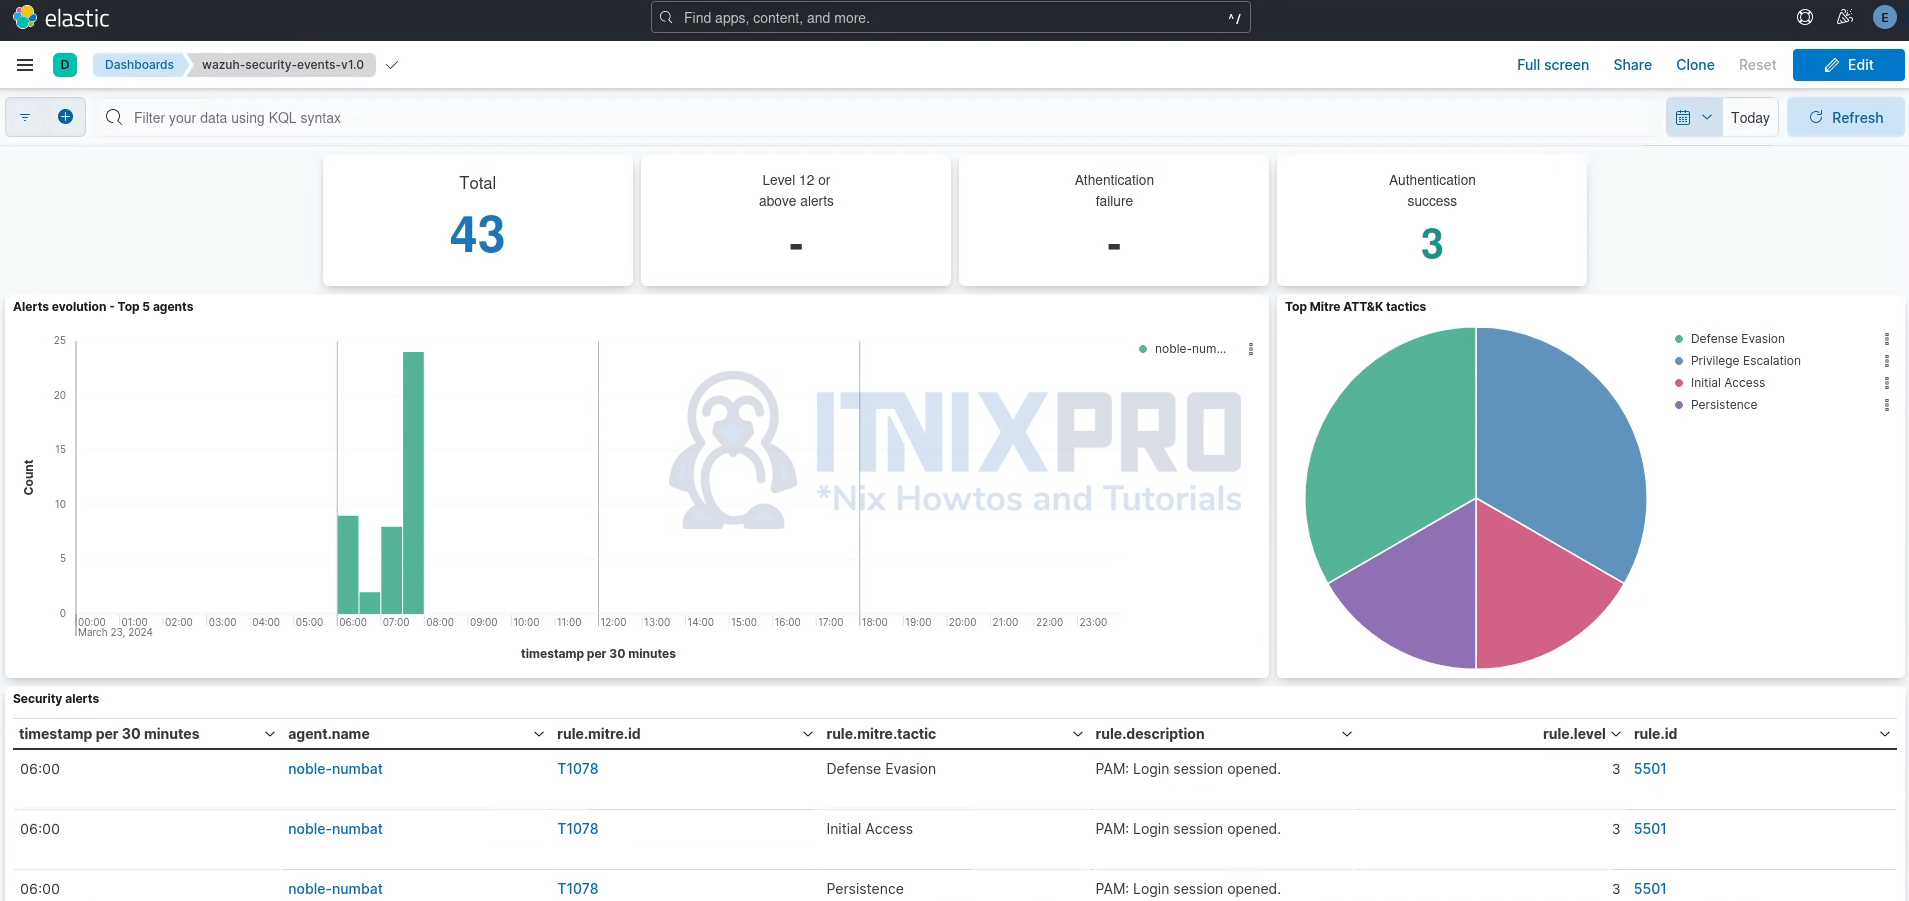
You can explore other dashboards.
Reference
Wazuh: Step-by-step installation
No link “Wazuh App”
Hi Bratella, try to reboot your system, if Wazuh app dont show up.