
In this tutorial, you will learn how to install Logstash on Debian systems. Logstash is a server‑side data processing pipeline for ELK stack that ingests data from multiple sources simultaneously, transforms it, and then sends it to a “stash” like Elasticsearch. This guide is a continuation of our previous guide on how to install ELK stack on Debian systems, link provided below;
Install ELK/Elastic Stack on Debian 10

How to Install Logstash on Debian
While setting up ELK stack, Logstash is the third component to be installed after Elasticsearch and Kibana. In the guide above, we already installed and setup Elasticsearch and Kibana.
Next, let us install Logstash on Debian 10.
Installing Elastic Stack APT repos
If you are following the guide above, we already covered how to install Elastic stack repos on Debian. However, if you have not already installed the repos, run the commands below to install them.
Import the ELK stack repository PGP signing Key;
wget -qO - https://artifacts.elastic.co/GPG-KEY-elasticsearch | sudo apt-key add -
Install ELK APT repository on Debian 10.
sudo apt install apt-transport-https
echo "deb https://artifacts.elastic.co/packages/7.x/apt stable main" | sudo tee /etc/apt/sources.list.d/elastic-7.x.list
Run system update to update the added repository;
apt update
As much as you can download the Logstash Debian binary for manual installation, i recommend installation from APT repositories.
Install Logstash on Debian 10
Once the repos are in place, run the command below to install Logstash on Debian;
apt install logstash
Testing Logstash Installation
Logstash data processing pipeline has three sections;
- INPUT: input section is used to ingest data from different endpoints into Logstash (
required). - FILTERS: which processes and transform the data received (
optional). - OUTPUT: which stashes processed data into a specified destination, which can be Elasticsearch (
required).
You can test Logstash installation by running the most basic pipeline as follows;
/usr/share/logstash/bin/logstash -e 'input { stdin { } } output { stdout {} }'
If you see the line, stating that the pipeline has been started and that the stdin plugin is waiting for input…
...
[INFO ] 2020-12-18 14:11:45.143 [[main]-pipeline-manager] javapipeline - Pipeline started {"pipeline.id"=>"main"}
The stdin plugin is now waiting for input:
[INFO ] 2020-12-18 14:11:45.218 [Agent thread] agent - Pipelines running {:count=>1, :running_pipelines=>[:main], :non_running_pipelines=>[]}
[Api Webserver] agent - Successfully started Logstash API endpoint {:port=>9600}
…then Logstash is running fine.
You can then paste some log line, for example, if we can paste the log line for user added to the syste;
Dec 18 14:13:28 elk useradd[1414]: new user: name=demouser, UID=1002, GID=1002, home=/home/demouser, shell=/bin/shYou can see how it parses the line, (it added the timestamp and the host information).
...
[INFO ] 2020-12-18 14:11:45.372 [Api Webserver] agent - Successfully started Logstash API endpoint {:port=>9600}
Dec 18 14:13:28 elk useradd[1414]: new user: name=demouser, UID=1002, GID=1002, home=/home/demouser, shell=/bin/sh
{
    "@timestamp" => 2020-12-18T19:15:56.165Z,
       "message" => "Dec 18 14:13:28 elk useradd[1414]: new user: name=demouser, UID=1002, GID=1002, home=/home/demouser, shell=/bin/sh",
          "host" => "elk.itnixpro.com",
      "@version" => "1"
}
Stop Logstash by pressing CTRL+C.
Configure Logstash to Process and Parse Logs
As stated above, there are three main sections of Logstash processing pipeline; the input, the filter and the output.
Under the INPUT plugin configuration, you can define specific source of logs. For example, in this setup, we wll be collecting logs from Beats, Filebeat, to be exact. As such, you Logstash INPUT configuration section will look like;
input {
  beats {
    port => 5044
  }
}
Under the optional filter section, if you want to apply further processing to your logs to extract fields of you interest, there are various filter plugins you can use.
In this setup, we will use a sample configuration Logstash filter plugin to simple system events using the Grok filters;
Take for example, you have such a sample log line, for user added to the systems;
Dec 18 14:13:28 elk useradd[1414]: new user: name=demouser, UID=1002, GID=1002, home=/home/demouser, shell=/bin/shAssuming we want to process such an event and extract such fields;
- event time (Dec 18 14:13:28)
- host (elk)
- the program (useradd)
- message (new user)
- name of the user account created (demouser)
- User ID (1002)
- User Group ID (1002)
- User home directory (/home/demouser)
- User shell (/bin/sh)
Note that this is just an example, since if you are using beats, there are already preconfigured dashboards that helps you visualize these events.
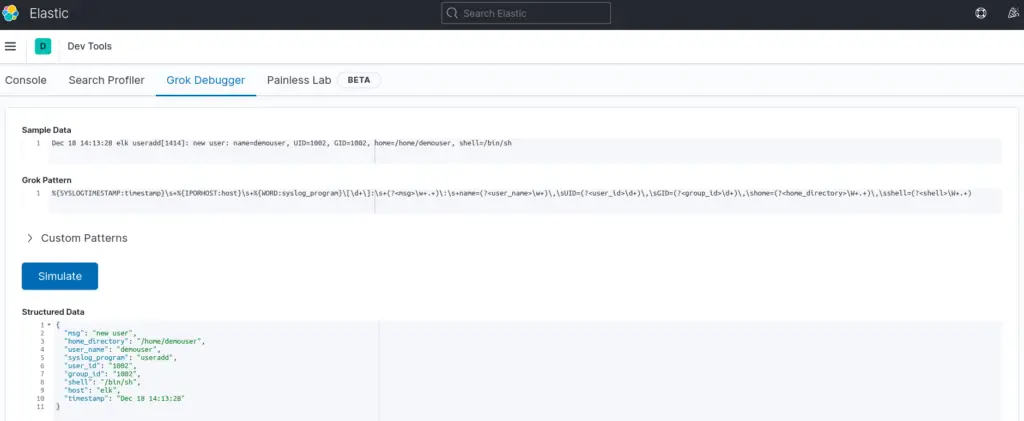
So, let say we want to extract the above fields from the user account creation events, this is how our sample Logstash Grok filter will look like (with custom name of the fields).
filter {
  grok {
    match => { "message" => "%{SYSLOGTIMESTAMP:timestamp}\s+%{IPORHOST:host}\s+%{WORD:syslog_program}\[\d+\]:\s+(?<msg>\w+.+)\:\s+name=(?<user_name>\w+)\,\sUID=(?<user_id>\d+)\,\sGID=(?<group_id>\d+)\,\shome=(?<home_directory>\W+.+)\,\sshell=(?<shell>\W+.+)" }
    add_field => { "activity" => "User Account Creation" }
    }
}
You can utilize the Kibana (Dev Tools > Grok Debugger) or the Heroku Grok debugger App to create your Grok filters. See sample Kibana grok filter below;
With the OUTPUT plugins, you can sent the processed/parsed event data to different destinations, be it to standard output, Elasticsearch etc.
For example, to sent the output to standard output, your Logstash output section will look like;
output {
    stdout { codec => rubydebug }
}
If you want to sent to Elasticsearch, your output may look like (in its simplest setup);
output {
  elasticsearch {
    hosts => ["192.168.58.10:9200"]
  }
}
Read more about Elasticsearch output plugin.
So, in general, you can create a configuration file for your Logstash plugins that will look like;
vim /etc/logstash/conf.d/account-created.conf
input {
  beats {
    port => 5044
  }
}
filter {
  grok {
    match => { "message" => "%{SYSLOGTIMESTAMP:timestamp}\s+%{IPORHOST:host}\s+%{WORD:syslog_program}\[\d+\]:\s+(?<msg>\w+.+)\:\s+name=(?<user_name>\w+)\,\sUID=(?<user_id>\d+)\,\sGID=(?<group_id>\d+)\,\shome=(?<home_directory>\W+.+)\,\sshell=(?<shell>\W+.+)" }
    add_field => { "activity" => "User Account Creation" }
    }
}
output {
  elasticsearch {
    hosts => ["192.168.58.10:9200"]
  }
}
Test Logstash Configuration
To ensure that there are no syntax errors in Logstash configurations, you can test it as follows;
/usr/share/logstash/bin/logstash --path.settings /etc/logstash -t
If there is no issue, you should get a Configuration OK message.
Configuration OK
[2020-12-18T15:28:20,975][INFO ][logstash.runner          ] Using config.test_and_exit mode. Config Validation Result: OK. Exiting Logstash
Testing Logstash filter processing
Before you can be sure that your filter works, you can test it before starting Logstash.
Replace the Beats input section of the Logstash standard input plugin. Similarly, replace the Elasticsearch output plugin with standard output plugin such that your configuration may look like;
input {
#  beats {
#    port => 5044
#  }
   stdin { }
}
filter {
  grok {
    match => { "message" => "%{SYSLOGTIMESTAMP:timestamp}\s+%{IPORHOST:host}\s+%{WORD:syslog_program}\[\d+\]:\s+(?<msg>\w+.+)\:\s+name=(?<user_name>\w+)\,\sUID=(?<user_id>\d+)\,\sGID=(?<group_id>\d+)\,\shome=(?<home_directory>\W+.+)\,\sshell=(?<shell>\W+.+)" }
    add_field => { "activity" => "User Account Creation" }
    }
}
output {
#  elasticsearch {
#    hosts => ["192.168.58.10:9200"]
#  }
   stdout { codec => rubydebug }
}
Next, save the file and run Logstash in debugging mode using the same configuration file. Be sure to check the configuration syntax before running the command.
/usr/share/logstash/bin/logstash -f /etc/logstash/conf.d/account-created.conf
Once you see these lines;
The stdin plugin is now waiting for input:
[INFO ] 2020-12-18 15:35:04.512 [Agent thread] agent - Pipelines running {:count=>1, :running_pipelines=>[:main], :non_running_pipelines=>[]}
[INFO ] 2020-12-18 15:35:04.692 [Api Webserver] agent - Successfully started Logstash API endpoint {:port=>9600}
Paste your log line to which you created the Grok filter for and press Enter. If the filter works fine, then you should see a JSON file with your custom fields extracted.
The stdin plugin is now waiting for input:
[INFO ] 2020-12-18 15:35:04.512 [Agent thread] agent - Pipelines running {:count=>1, :running_pipelines=>[:main], :non_running_pipelines=>[]}
[INFO ] 2020-12-18 15:35:04.692 [Api Webserver] agent - Successfully started Logstash API endpoint {:port=>9600}
Dec 18 14:13:28 elk useradd[1414]: new user: name=demouser, UID=1002, GID=1002, home=/home/demouser, shell=/bin/sh
{
             "shell" => "/bin/sh",
           "message" => "Dec 18 14:13:28 elk useradd[1414]: new user: name=demouser, UID=1002, GID=1002, home=/home/demouser, shell=/bin/sh",
        "@timestamp" => 2020-12-18T20:36:29.356Z,
           "user_id" => "1002",
    "home_directory" => "/home/demouser",
          "@version" => "1",
         "user_name" => "demouser",
          "group_id" => "1002",
         "timestamp" => "Dec 18 14:13:28",
               "msg" => "new user",
              "host" => [
        [0] "elk.itnixpro.com",
        [1] "elk"
    ],
    "syslog_program" => "useradd",
          "activity" => "User Account Creation"
}
Next, stop Logstash and change the input and output back to initial setup.
Running Logstash
To be able to receive logs from remove endpoints via Beats, then start Logstash with input section configured with Beats input plugin.
systemctl enable --now logstash
For any errors, please check the /var/log/logstash/logstash-plain.log file.
Install Filebeat
In our next setup, we will learn how to install Filebeat and sent logs directly to Elasticsearch or Logstash for further processing.