
Welcome again to our yet another tutorial on how to install Filebeat on Debian 10. Filebeat is lightweight shipper for logs. It enables you to collect logs or event data from security devices, cloud, containers, hosts, etc and stashes them on a central location.

Install Filebeat on Debian 10
This guide is a continuation of our previous guide on how to install and setup ELK/Elastic stack on Debian. The link is provided below;
Install ELK/Elastic Stack on Debian 10
Installing Filebeat
Debian 10 repos do not provide any Elastic package on its default repositories. As such, in order to install Filebeat or any other Elastic component on Debian, you first need to install the Elastic repository.
If you followed the guide above, we already covered how to install Elastic repo on Debian systems. However, if you haven’t installed the repos, then this is how to install it;
Import the ELK stack repository PGP signing Key;
wget -qO - https://artifacts.elastic.co/GPG-KEY-elasticsearch | sudo apt-key add -
Install ELK APT repository on Debian 10.
sudo apt install apt-transport-https
echo "deb https://artifacts.elastic.co/packages/7.x/apt stable main" | sudo tee /etc/apt/sources.list.d/elastic-7.x.list
Run system update to update the added repository;
apt update
Once the repos are in place and package cache updated, then install Filebeat on Debian 10;
apt install filebeat
Configuring Filebeat to collect Log data
The default configuration file for Filebeat is /etc/filebeat/filebeat.yml.
The first thing you need to do is to configure Filebeat to collect log data. Filebeat can use various Filebeat input types or Filebeat modules to manually or automatically to collect data.
Collecting Logs using Filebeat Input Types
For example, if you want to collect logs from a specific log file, you can use the log input to read lines from that specific log files. In this case, open the Filebeat configuration file for editing;
vim /etc/filebeat/filebeat.yml
Under the Filebeat inputs section, the type of the input defined is the log input type, but it is disabled (enabled: false);
# ============================== Filebeat inputs ===============================

filebeat.inputs:
...
- type: log
...
  enabled: false
...
  paths:
    - /var/log/*.log
...- To enable this log input configuration, change the
enabled: falsetoenabled: true. - To read specific log file, specify the path, specify one path per line. Each line should begin with a dash (-).
- You can read multiple files spanning multiple subdirectories. Read more about the path wildcards on inputs path page.
For example, to read /var/log/syslog and /var/log/auth.log, individually using the log input type, this is how your configuration would look like;
# ============================== Filebeat inputs ===============================

filebeat.inputs:
- type: log
  enabled: true
  paths:
    - /var/log/auth.log
    - /var/log/syslog
Collecting Logs using Filebeat Modules
Instead of using input types, Filebeat supports various modules which can be used to simplify the collection, parsing, and visualization of common log formats. Filebeat supports multiple modules. No module is enabled by default. to list supported Filebeat modules;
filebeat modules list
Enabled:

Disabled:
activemq
apache
auditd
aws
azure
barracuda
bluecoat
...
When you use Filebeat modules;
- Filebeat reads the default log files for the specific application whose module is enabled. e.g system module reads syslog (syslog/messages) and authentication logs (auth.log or secure). These logs files are what is called the fileset.
- Each fileset contains;
- Elasticsearch Ingest Node pipeline definition, which is used to parse the log lines.
- Fields definitions, which are used to configure Elasticsearch with the correct types for each field. They also contain short descriptions for each of the fields.
- Sample Kibana dashboards, when available, that can be used to visualize the log files.
All Filebeat modules are placed under the /etc/filebeat/modules.d/ directory. All modules that are not enabled have the suffix, .disabled.
To enable a module, run the command below;
filebeat modules enable <name-of-the-module>
Where <name-of-the-module> is the name of the specific application module you want to enable. For example, you can enable system module by running the command below;
filebeat modules enable system
Since the module read the default log files, you can configure it to read your specific logs (if default log paths are not used).
For example, this is how Filebeat system module looks like by default (comment lines and empty lines removed);
- module: system
  syslog:
    enabled: true
  auth:
    enabled: true
To explicitly define the paths, use the var.paths parameter. See example below;
- module: system
  syslog:
    enabled: true
    var.paths: ["/var/log/syslog"]
  auth:
    enabled: true
    var.paths: ["/var/log/auth.log"]
The same applies to the rest of the modules.
Configure Filebeat Outputs
Filebeat can be configured to send log data to various destinations including Elasticsearch, Logstash, Kafka, File…
In this setup however, Elasticsearch and Logstash destinations are covered.
Sending logs to Elasticsearch;
vim /etc/filebeat/filebeat.yml
By default, Filebeat is configured with Elasticsearch output enabled. However, it expects the Elasticsearch to be running on the localhost.
# ---------------------------- Elasticsearch Output ----------------------------
output.elasticsearch:
  # Array of hosts to connect to.
  hosts: ["localhost:9200"]
To sent logs to remote Elasticsearch, simply replace the localhost with Elasticsearch node IP or resolvable hostname.
Sending logs to Logstash;
If you want to apply further processing and routing of generated events, you can sent your data to Logstash. Note that you need to have configured Logstash to expect input logs from beats as we did in our previous guide on setting up ELK stack before this can work. Also, ensure that Elasticsearch output is disabled;
# ---------------------------- Elasticsearch Output ----------------------------
#output.elasticsearch:
  #hosts: ["localhost:9200"]

# ------------------------------ Logstash Output -------------------------------
output.logstash:
  # The Logstash hosts
  #hosts: ["localhost:5044"]
  hosts: ["192.168.58.10:5044"]
...
Save and exit the file,
Load Kibana Dashboards
Filebeat ships with example dashboards, visualizations, and searches for visualizing Filebeat data in Kibana. Dashboard loading is disabled by default.
There multiple ways in which you can configure Kibana dashboard loading on Filebeat.
- Enable dashboard loading and define Kibana endpoint in Filebeat configuration;
vim /etc/filebeat/filebeat.yml
# ================================= Dashboards =================================
#setup.dashboards.enabled: false
setup.dashboards.enabled: true
...
# =================================== Kibana ===================================
setup.kibana:
  #host: "localhost:5601"
  host: "192.168.58.10:5601"
Ensure that Kibana is reachable.
This method ensures that the dashboards are loaded every time Filebeat starts and there is a connection to Kibana endpoint. It also works with Elasticsearch output enabled,
- To load the dashboards once, configure Kibana endpoint connection details and use the
Filebeat setup commandto load the dashboards. This method works with Elasticsearch output enabled.
# =================================== Kibana ===================================
setup.kibana:
  #host: "localhost:5601"
  host: "192.168.58.10:5601"
filebeat setup --dashboards
- Loading dashboards for Logstash output: To load dashboards when the Logstash output is enabled, you need to temporarily disable the Logstash output and enable Elasticsearch. If you have configured your Filebeat to sent your data to Logstash, then you need to run the command below to load the dashboards to Kibana.
filebeat setup -e -E output.logstash.enabled=false -E 'output.elasticsearch.hosts=["ELASTIC_ADDRESS:9200"]' -E setup.kibana.host=KIBANA_HOST_ADDRESS:5601
Replace the ELASTIC_ADDRESS and KIBANA_HOST_ADDRESS accordingly.
- Note that, if you are sending your data to Logstash, you need to configure Logstash to use the index reported by Filebeat for indexing events into Elasticsearch because the loaded dashboards expects to find the Filebeat index (
filebeat*). Hence, ensure that your Logstash OUTPUT pipeline processing configuration is set to create the filebeat index. See example Logstash output below;
output {
  elasticsearch {
    hosts => ["192.168.58.10:9200"]
    index => "%{[@metadata][beat]}-%{[@metadata][version]}"
  }
}
The line, index => "%{[@metadata][beat]}-%{[@metadata][version]}", will force Logstash to create an index like, filebeat-7.10.1.
Test Filebeat Configuration Settings
In order to test Filebeat configuration settings, run the command below;
filebeat test config
If you get the output, Config OK, then the configuration is fine.
Test Filebeat Output connection
To confirm whether Filebeat can connect to the destination output, run the command below;
filebeat test output
You should get such a sample output;
  connection...
    parse host... OK
    dns lookup... OK
    addresses: 192.168.58.10
    dial up... OK
  TLS... WARN secure connection disabled
  talk to server... OK
Running Filebeat
Now that the configuration is fine and that you can connect to the destination output, you can now run Filebeat.
If you want to run Filebeat in foreground and log to stderr and disable syslog/file output, execute the command below;
filebeat -e
To run Filebeat in background as a service, you can start and enable it to run on system boot;
systemctl enable --now filebeat
Disable Filebeat Syslog Logging
By default, Filebeat logs to syslog. If you need to disable this, you can configure Filebeat to write its default log file, /var/log/filebeat/filebeat.
Enter the following lines in your Filebeat configuration file.
logging.level: info
logging.to_files: true
logging.files:
  path: /var/log/filebeat
  name: filebeat
  keepfiles: 4
  permissions: 0644
Save the file and restart Filebeat. You should then have Filebeat writing to /var/log/filebeat/filebeat.
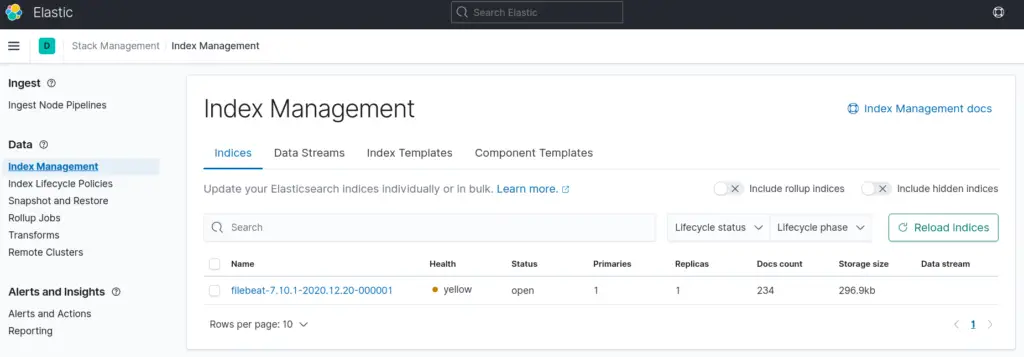
Create Kibana Index
Since Filebeat is now collecting data and sending them to your ELK stack, you should be able to see the index in which it is configured to write to on ELK. You can check from Kibana UI > Stack Management > Elasticsearch > Index Management.
You can as well verify using curl command;
curl -X GET 192.168.58.10:9200/_cat/indices?v
health status index                           uuid                   pri rep docs.count docs.deleted store.size pri.store.size
green  open   .apm-custom-link                hOiOC5K_TPSJTp9Pr75yJA   1   0          0            0       208b           208b
green  open   .kibana_task_manager_1          vxJDBwsJTleSsKQwZQqk9w   1   0          5          136    204.1kb        204.1kb
green  open   .apm-agent-configuration        _0YmN_XSQryh5BxfOYnRkw   1   0          0            0       208b           208b
green  open   .kibana-event-log-7.10.1-000001 GDSJPU75RoSwXYhRmTklPg   1   0          3            0     16.4kb         16.4kb
yellow open   filebeat-7.10.1                 PXYKR0DbRbaipW6RoDdQOw   1   1        338            0    330.1kb        330.1kb
green  open   .async-search                   gULzhXfUSeCzGe_GxjX6WA   1   0          0            0      3.5kb          3.5kb
green  open   .kibana_1                       eFqpGyM8RQad5GWddujzGQ   1   0       1529           32      2.4mb          2.4mb
So to create Kibana Filebeat index, navigate to Stack Management > Kibana > Index Patterns > Create Index Pattern > Specify the wildcard of your index pattern > Select a primary time field for use with the global time filter > Create Index pattern.
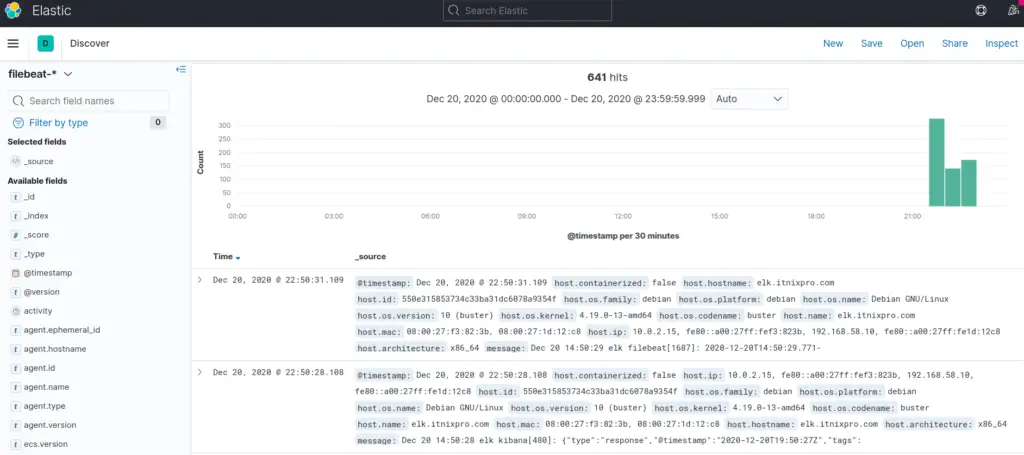
Visualize Filebeat Data on Kibana
Navigate to Kibana Discover menu to confirm your log data;
To view the dashboards, click Dashboards menu and select any Filebeat dashboard.
That marks the end of our tutorial on how to install Filebeat on Debian 10.
Reference
Other Tutorials
How to Install Logstash on Debian