
Follow through this guide to learn how to monitor HAProxy logs with ELK Stack. Logs generated by HAProxy can be collected using Elastic beats and pushed to ELK stack for processing and visualization.
Monitor HAProxy Logs with ELK Stack
In order to be able to collect and monitor HAProxy logs with ELK stack, you need to already having ELK stack setup and HAProxy configured. These are the assumptions we make before we proceed.
You can however check our ELK stack tutorials by following the link below;
So, to monitor HAProxy logs with ELK Stack using Filebeat;
- Install Filebeat on HAProxy host server
- Configure Filebeat to collect and sent HAProxy logs to ELK Stack.
- Your output can be to Elasticsearch, or to Logstash if you want to use your own custom filters to apply further processing to the HAProxy logs.
- Start Filebeat to start collecting HAProxy logs
- Confirm that the HAProxy logs have been received by Elasticsearch and can be visualized on Kibana.
Install on HAProxy Host server
Depending on HAProxy host server OS distribution, you need to install Filebeat that will enable you to collect the HAProxy logs and push them to ELK stack for visualization.
Before you can proceed to install Filebeat, you need to get the version of your current ELK stack. It is recommended all the components of the ELK stack including the beats be of the same version;
You can check the version from Kibana package.json file;
grep 7.17.0 /usr/share/kibana/package.json "version": "7.17.0",or from Elasticsearch;
curl localhost:9200{
"name" : "elk.itnixpro.com",
"cluster_name" : "elasticsearch",
"cluster_uuid" : "pE3v-1oSTfaiF3Dp2VbOjg",
"version" : {
"number" : "7.17.0",
"build_flavor" : "default",
"build_type" : "deb",
"build_hash" : "bee86328705acaa9a6daede7140defd4d9ec56bd",
"build_date" : "2022-01-28T08:36:04.875279988Z",
"build_snapshot" : false,
"lucene_version" : "8.11.1",
"minimum_wire_compatibility_version" : "6.8.0",
"minimum_index_compatibility_version" : "6.0.0-beta1"
},
"tagline" : "You Know, for Search"
}
As you can see, we are running ELK stack 7.17.0
- Install Filebeat on Ubuntu/Debian Related systems;
Download Filebeat DEB binary that matches the version of the ELK stack from the downloads page. You can use the command below;
VERSION=7.17.0wget https://artifacts.elastic.co/downloads/beats/filebeat/filebeat-${VERSION}-amd64.debOnce the download is complete, install filebeat as follows;
sudo apt install ./filebeat-${VERSION}-amd64.deb- Install Filebeat on CentOS/RHEL/Rocky Linux;
VERSION=7.17.0yum localinstall https://artifacts.elastic.co/downloads/beats/filebeat/filebeat-${VERSION}-x86_64.rpmConfigure Filebeat to collect and sent HAProxy logs to ELK Stack
In this tutorial, we will be configuring Filebeat to collect and sent HAProxy logs directly to Elasticsearch.
Thus, before you can proceed, confirm that Elasticsearch is reachable;
nc -vz 192.168.60.28 9200If all is good, you should get the connection succeeded output;
Connection to 192.168.60.28 9200 port [tcp/*] succeeded!Open the Filebeat configuration file and configure Elasticsearch Output.
cp /etc/filebeat/filebeat.yml{,.old}vim /etc/filebeat/filebeat.ymlUpdate the Output section as follows;
output.elasticsearch:
  hosts: ["192.168.60.28:9200"]
If your Elasticsearch requires authentication and or SSL/TLS, then check how to configure secure Filebeat-Elasticsearch communication section for more info.
Save and exit the Filebeat config.
Test Filebeat Output;
filebeat test outputSuch output confirms all is good.
elasticsearch: http://192.168.60.28:9200...
  parse url... OK
  connection...
    parse host... OK
    dns lookup... OK
    addresses: 192.168.60.28
    dial up... OK
  TLS... WARN secure connection disabled
  talk to server... OK
  version: 7.17.0
This is how our Filebeat config file looks like;
cat /etc/filebeat/filebeat.ymlfilebeat.inputs:
- type: filestream
enabled: false
paths:
- /var/log/*.log
filebeat.config.modules:
path: ${path.config}/modules.d/*.yml
reload.enabled: false
setup.template.settings:
index.number_of_shards: 1
setup.kibana:
output.elasticsearch:
hosts: ["192.168.60.28:9200"]
processors:
- add_host_metadata:
when.not.contains.tags: forwarded
- add_cloud_metadata: ~
- add_docker_metadata: ~
- add_kubernetes_metadata: ~
logging.level: info
logging.to_files: true
logging.files:
path: /var/log/filebeat
name: filebeat
keepfiles: 7
permissions: 0644
seccomp:
default_action: allow
syscalls:
- action: allow
names:
- rseq
With the above config, Filebeat will write event data to default filebeat index on Elasticsearch. You can however specify your custom index.
Next, you need to configure Filebeat to collect HAProxy logs. In this tutorial, we will utilize Filebeat HAProxy module. Filebeat modules simplify the collection, parsing, and visualization of common log formats and are store under /etc/filebeat/modules.d/ directory for various supported applications and tools.
Filebeat ships with HAProxy module by default. All the modules are disabled by default.
Thus, to use Filebeat HAProxy module, you need to enable the module;
filebeat modules enable haproxyThe command will remove the .disabled extension from the module configuration file. The module is by default configured to run via syslog on port 9001. However, our HAProxy logs is written to a file, /var/log/haproxy.log.
Thus, edit the Filebeat HAproxy module configuration file and configure it to read HAProxy logs from the file;
cp /etc/filebeat/modules.d/haproxy.yml{,.bak}vim /etc/filebeat/modules.d/haproxy.yml- module: haproxy
log:
enabled: true
var.input: "file"
var.paths:
- "/var/log/haproxy.log"
Save and exit the file.
Test Filebeat config for any error. Output should be Ok if no errors
filebeat test configLoad Filebeat Kibana Dashboards/Visualization/Searches
Filebeat ships with Kibana dashboards, visualizations, and searches for visualizing Filebeat data in Kibana.
If the dashboards are not already loaded, then you can load as follows (Kibana must be running and reachable);
filebeat setup --dashboards -E setup.kibana.host=192.168.60.28:5601if using Logstash as output and want to load dashboard, check the documentation on how to.
Start Filebeat Service
You can start Filebeat to run as a service or just ran in debug mode (filebeat -e);
systemctl start filebeatYou can tail the logs;
tail -f /var/log/filebeat/filebeatIf the HAProxy is actively writing to the logs path, /var/log/haproxy.log, then Filebeat will start to read it and sent the logs to Elasticsearch.
View HAProxy Logs on Kibana
In order to be able to view event data in Kibana, you need to create specific Index pattern on Kibana (Menu > Management > Stack Management > Kibana > Index Patterns > Pattern > Timestamp > create index pattern).
Once you have an index pattern created on Kibana, then you can navigate to Kibana Discover menu and select your respective index to view the events.
In our example, logs are written to filebeat index.
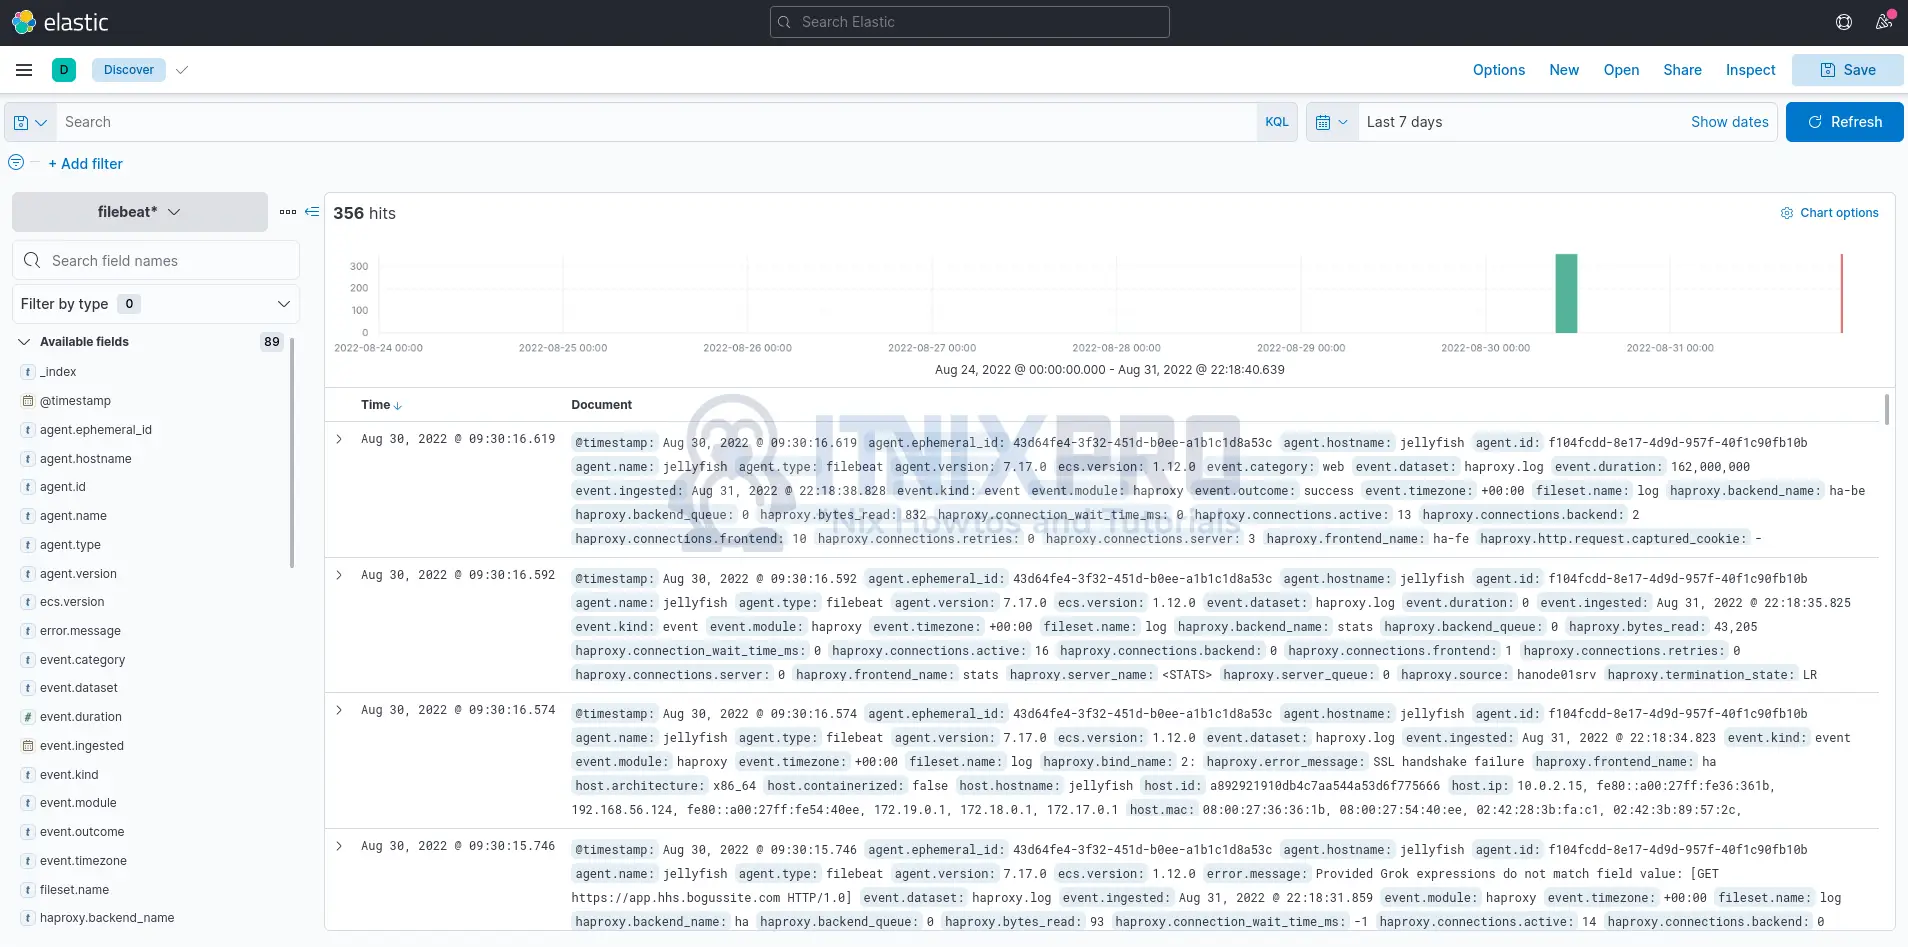
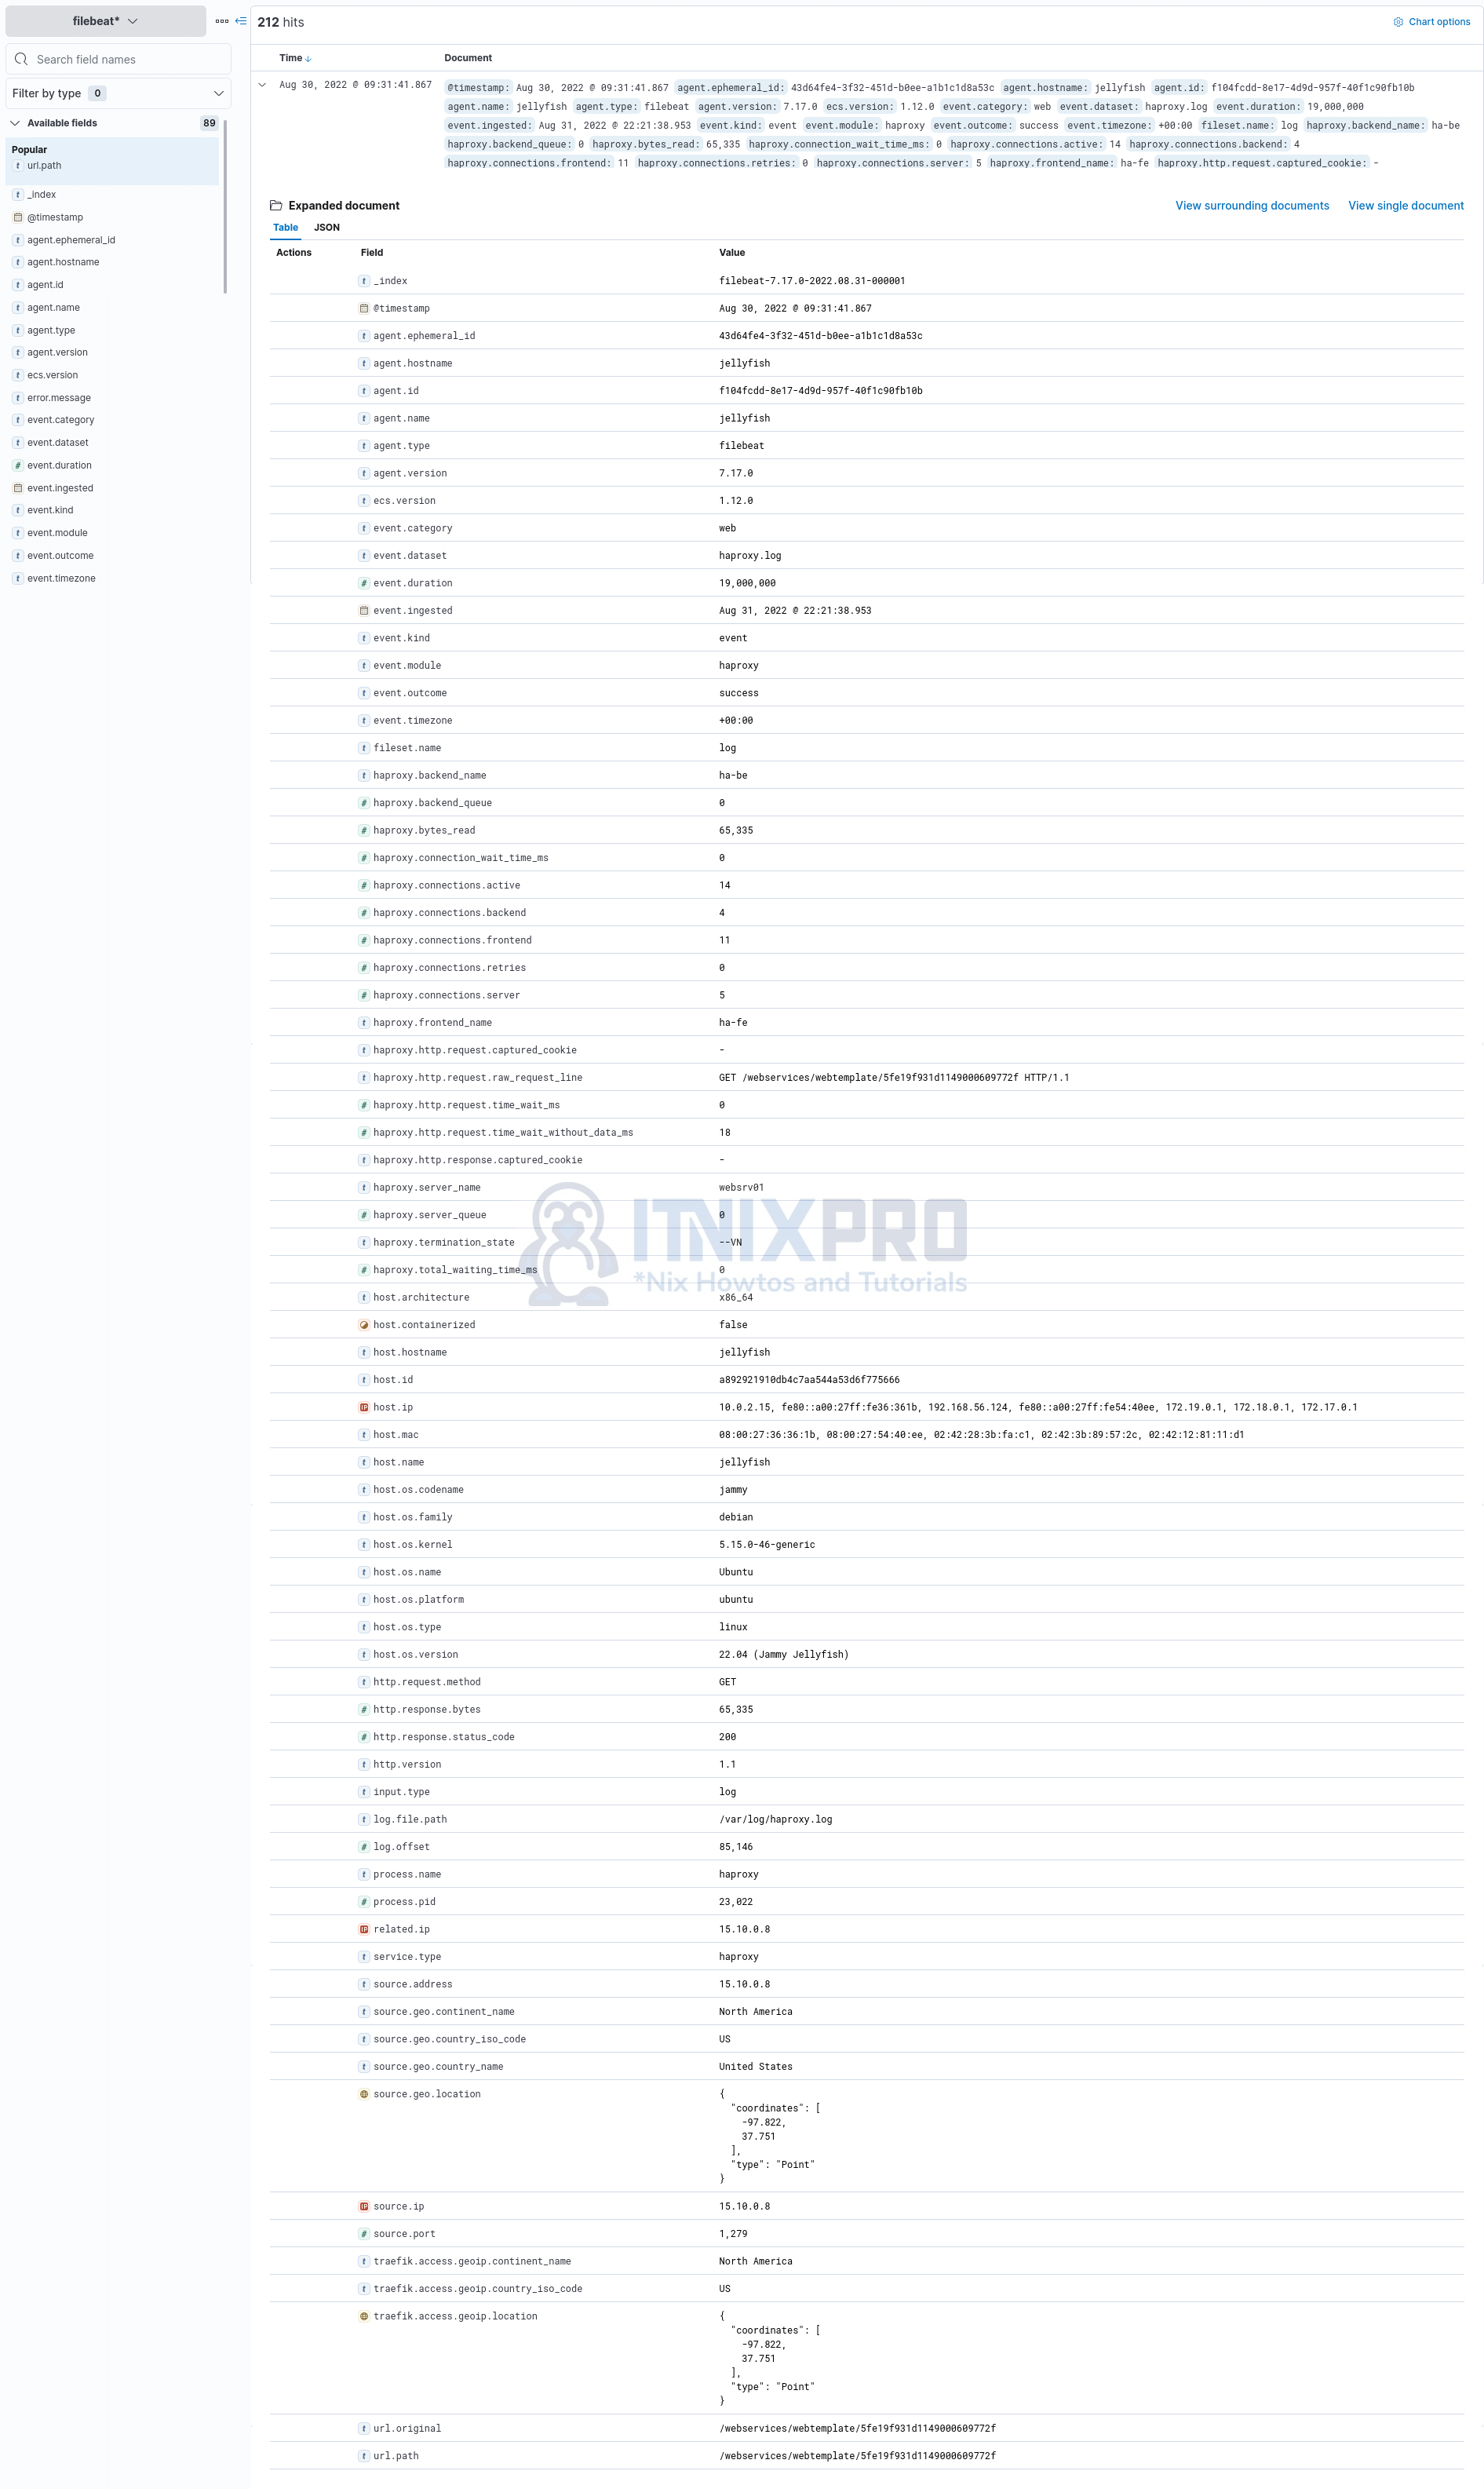
Sample event details;
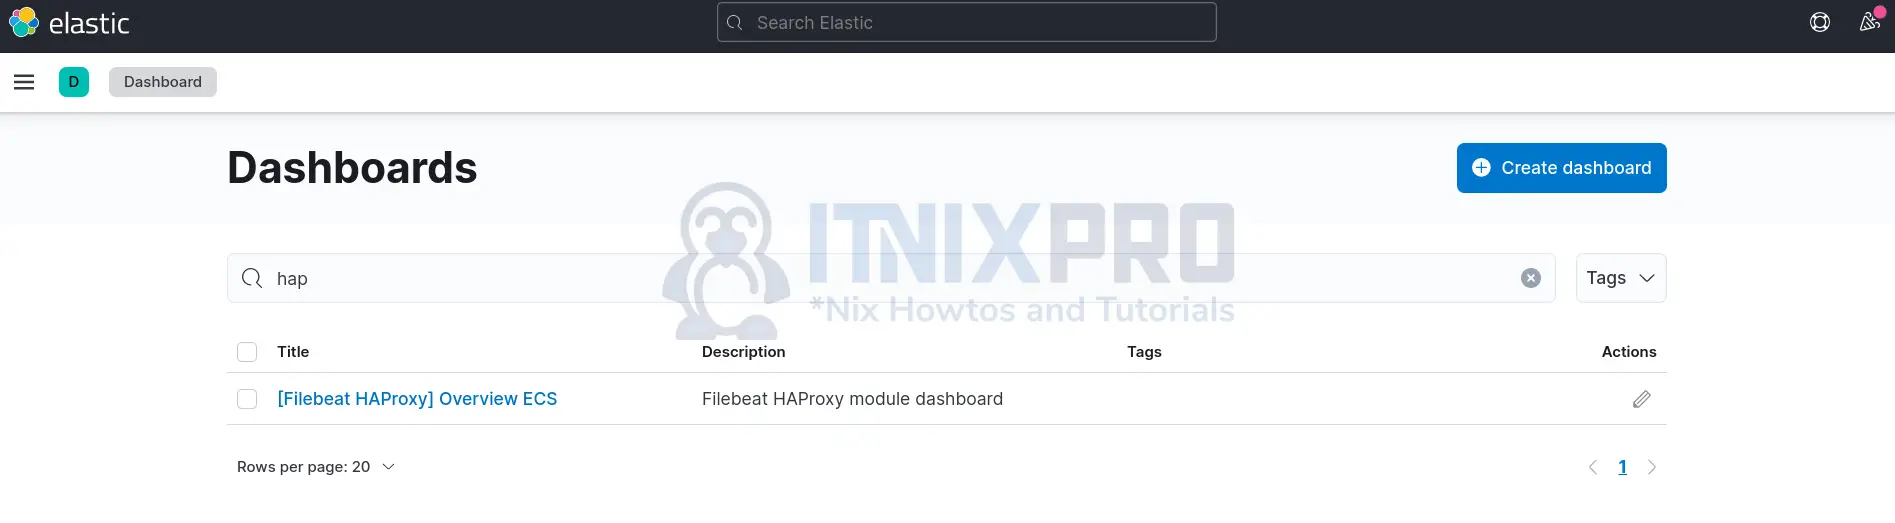
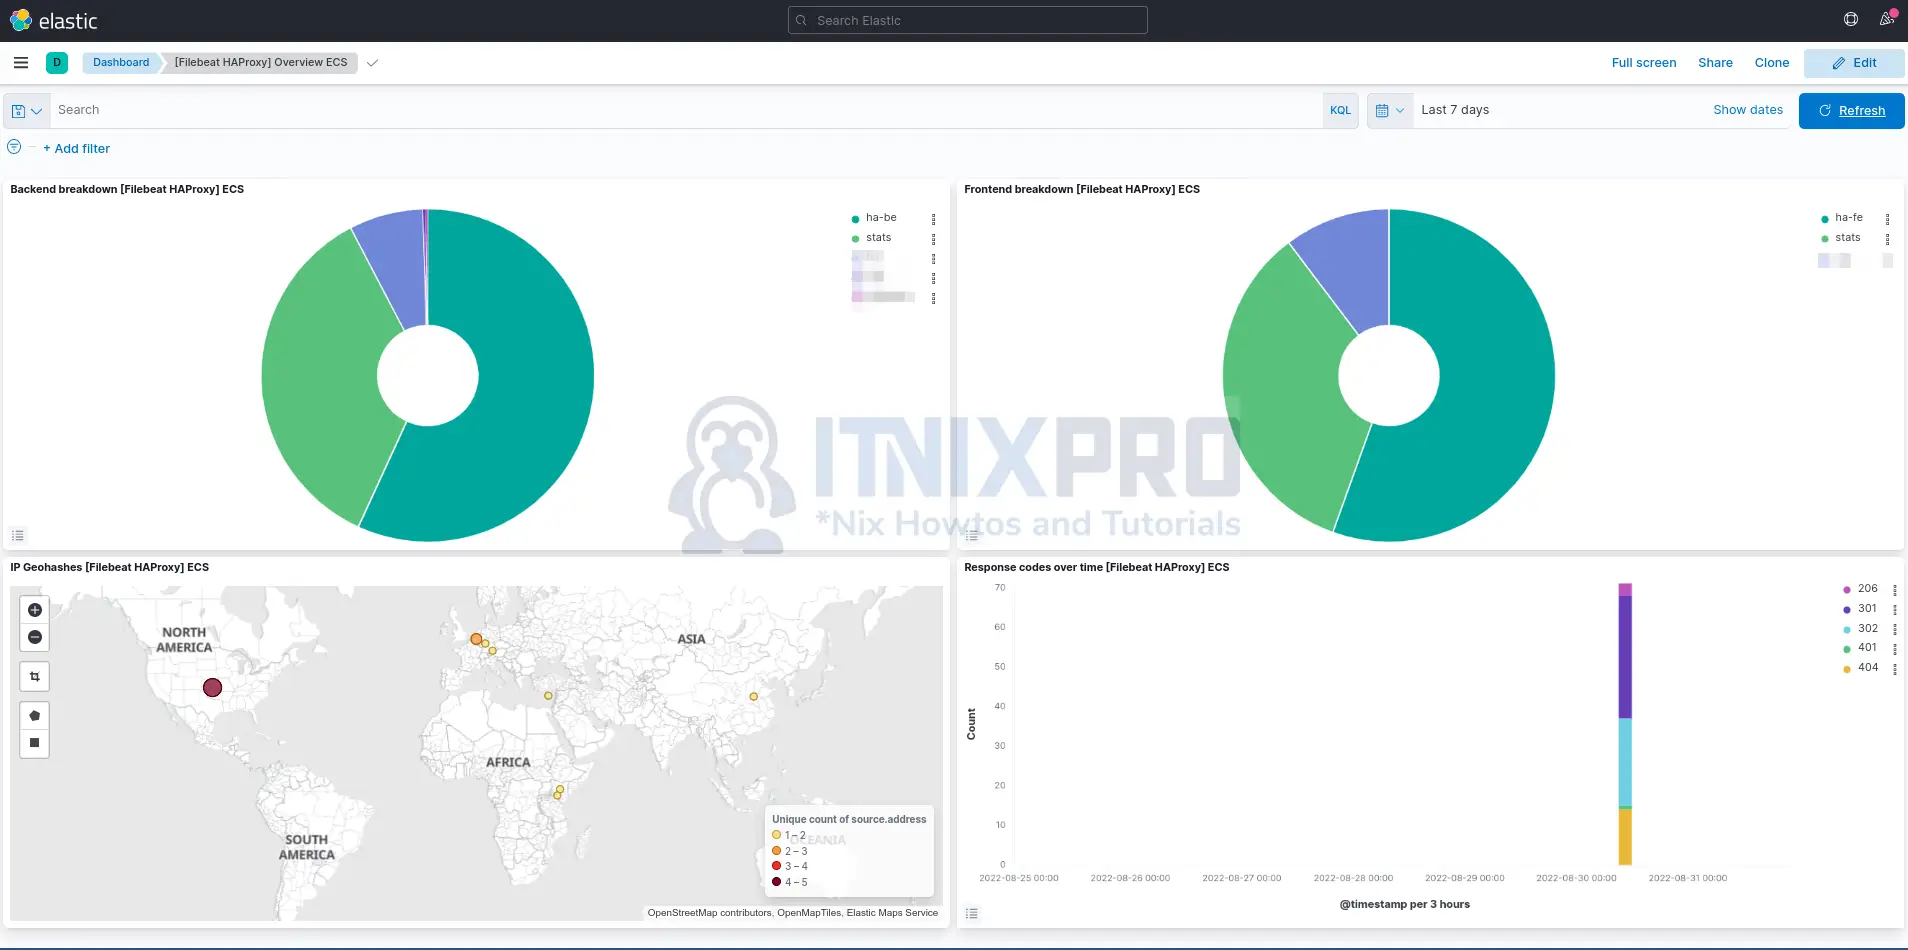
Sample Dashboards;
And that concludes our guide on how to monitor HAProxy logs with ELK Stack.
Other Tutorials