
This article is going to take you through on how to Install Filebeat 8 on Rocky Linux. Filebeat is a small shipper for forwarding and storing log data. Filebeat is a server-side agent that monitors the log files or locations you designate, collects log events, and sends them to Elasticsearch or Logstash for indexing.
How to Install Filebeat 8 on Rocky Linux
- Filebeat repo isn’t available by default on Rocky Linux
- Therefore, start by installing Elastic Stack repositories by running the command below;
cat > /etc/yum.repos.d/elasticsearch.repo << 'EOL'
[elasticsearch-8.x]
name=Elasticsearch repository for  8.x packages
baseurl=https://artifacts.elastic.co/packages/8.x/yum
gpgcheck=1
gpgkey=https://artifacts.elastic.co/GPG-KEY-elasticsearch
enabled=1
autorefresh=1
type=rpm-md
EOL
- Next, import the GPG signing key for Elastic Stack repository.
sudo rpm --import https://artifacts.elastic.co/GPG-KEY-elasticsearch- After setting up the repo we are ready to install Filebeat 8 on Rocky Linux.
sudo dnf install filebeatSample output
Dependencies resolved.
===================================================================
 Package      Arch       Version       Repository             Size
===================================================================
Installing:
 filebeat     x86_64     8.1.1-1       elasticsearch-8.x      35 M

Transaction Summary
===================================================================
Install  1 Package

Total download size: 35 M
Installed size: 139 M
Is this ok [y/N]: y
Downloading Packages:
filebeat-8.1.1-x86_64.rpm          3.4 MB/s |  35 MB     00:10
-------------------------------------------------------------------
Total                              3.4 MB/s |  35 MB     00:10
Running transaction check
Transaction check succeeded.
Running transaction test
Transaction test succeeded.
Running transaction
  Preparing        :                                           1/1
  Installing       : filebeat-8.1.1-1.x86_64                   1/1
  Running scriptlet: filebeat-8.1.1-1.x86_64                   1/1
  Verifying        : filebeat-8.1.1-1.x86_64                   1/1

Installed:
  filebeat-8.1.1-1.x86_64

Complete!
Configuring Filebeat 8.x on Rocky Linux
After installing Filebeat, you can now proceed to configure it to sent logs to various processing endpoint. Be it Elasticsearch or Logstash.
The default configuration file for Filebeat is /etc/filebeat/filebeat.yml.
Without comment lines and empty lines, this is how to the Filebeat configuration file looks like;
grep -Ev "^.*#|^$" /etc/filebeat/filebeat.ymlfilebeat.inputs:
- type: filestream
enabled: false
paths:
- /var/log/*.log
filebeat.config.modules:
path: ${path.config}/modules.d/*.yml
reload.enabled: false
setup.template.settings:
index.number_of_shards: 1
setup.kibana:
output.elasticsearch:
hosts: ["localhost:9200"]
processors:
- add_host_metadata:
when.not.contains.tags: forwarded
- add_cloud_metadata: ~
- add_docker_metadata: ~
- add_kubernetes_metadata: ~
To begin the Filebeat configuration with;
- Define the Filebeat Inputs
Filebeat inputs define how Filebeat can collect the logs for processing;
# filestream is an input for collecting log messages from files.
- type: filestream

  # Change to true to enable this input configuration.
  enabled: false

  # Paths that should be crawled and fetched. Glob based paths.
  paths:
    - /var/log/*.log
    #- c:\programdata\elasticsearch\logs\*

  # Exclude lines. A list of regular expressions to match. It drops the lines that are
  # matching any regular expression from the list.
  #exclude_lines: ['^DBG']

  # Include lines. A list of regular expressions to match. It exports the lines that are
  # matching any regular expression from the list.
  #include_lines: ['^ERR', '^WARN']

  # Exclude files. A list of regular expressions to match. Filebeat drops the files that
  # are matching any regular expression from the list. By default, no files are dropped.
  #prospector.scanner.exclude_files: ['.gz$']

  # Optional additional fields. These fields can be freely picked
  # to add additional information to the crawled log files for filtering
  #fields:
  #  level: debug
  #  review: 1
By default, filestream Filebeat input is defined, but is also disabled, enabled: false. Read more about Filebeat inputs types.
- Configure Filebeat Modules
Filebeat modules can also be used to collect logs in a system. They simplify the collection, parsing, and visualization of common log formats.
The Filebeat modules are stored under /etc/filebeat/modules.d/ directory.
All the Filebeat modules are disabled by default. As you can see, most of them have .disabled extension;
ls /etc/filebeat/modules.d/activemq.yml.disabled crowdstrike.yml.disabled iis.yml.disabled mysqlenterprise.yml.disabled postgresql.yml.disabled system.yml apache.yml.disabled cyberarkpas.yml.disabled imperva.yml.disabled mysql.yml.disabled proofpoint.yml.disabled system.yml.disabled auditd.yml.disabled cylance.yml.disabled infoblox.yml.disabled nats.yml.disabled rabbitmq.yml.disabled threatintel.yml.disabled awsfargate.yml.disabled elasticsearch.yml.disabled iptables.yml.disabled netflow.yml.disabled radware.yml.disabled tomcat.yml.disabled aws.yml.disabled envoyproxy.yml.disabled juniper.yml.disabled netscout.yml.disabled redis.yml.disabled traefik.yml.disabled azure.yml.disabled f5.yml.disabled kafka.yml.disabled nginx.yml.disabled santa.yml.disabled zeek.yml.disabled barracuda.yml.disabled fortinet.yml.disabled kibana.yml.disabled o365.yml.disabled snort.yml.disabled zookeeper.yml.disabled bluecoat.yml.disabled gcp.yml.disabled logstash.yml.disabled okta.yml.disabled snyk.yml.disabled zoom.yml.disabled cef.yml.disabled google_workspace.yml.disabled microsoft.yml.disabled oracle.yml.disabled sonicwall.yml.disabled zscaler.yml.disabled checkpoint.yml.disabled haproxy.yml.disabled misp.yml.disabled osquery.yml.disabled sophos.yml.disabled cisco.yml.disabled ibmmq.yml.disabled mongodb.yml.disabled panw.yml.disabled squid.yml.disabled coredns.yml.disabled icinga.yml.disabled mssql.yml.disabled pensando.yml.disabled suricata.yml.disabled
You can also confirm by running the command;
filebeat modules listEnabled: system Disabled: activemq apache auditd aws awsfargate azure barracuda bluecoat cef checkpoint cisco coredns crowdstrike cyberarkpas cylance elasticsearch envoyproxy f5 fortinet gcp google_workspace haproxy ibmmq icinga iis imperva infoblox iptables juniper kafka kibana logstash microsoft misp mongodb mssql mysql mysqlenterprise nats netflow netscout nginx o365 okta oracle osquery panw pensando postgresql proofpoint rabbitmq radware redis santa snort snyk sonicwall sophos squid suricata system threatintel tomcat traefik zeek zookeeper zoom zscaler
As you can see, only system module is enabled.
To enable a module, you can either remove the .disabled extension;
cp /etc/filebeat/modules.d/system.yml{.disabled,}Or use the command;
filebeat modules enable <module name>Once you have enabled the module, also enable the filesets. For example, the default system.yml module configuration file looks like;
cat /etc/filebeat/modules.d/system.yml# Module: system
# Docs: https://www.elastic.co/guide/en/beats/filebeat/8.1/filebeat-module-system.html
- module: system
# Syslog
syslog:
enabled: false
# Set custom paths for the log files. If left empty,
# Filebeat will choose the paths depending on your OS.
#var.paths:
# Authorization logs
auth:
enabled: false
# Set custom paths for the log files. If left empty,
# Filebeat will choose the paths depending on your OS.
#var.paths:
As you can see, filesets are disabled. Simply enable by running;
sed -i '/enabled:/s/false/true/g' /etc/filebeat/modules.d/system.ymlYou can also define specific logs to collect, example below, check values for var.paths: parameter;
# Module: system
# Docs: https://www.elastic.co/guide/en/beats/filebeat/8.1/filebeat-module-system.html

- module: system
  # Syslog
  syslog:
    enabled: true

    # Set custom paths for the log files. If left empty,
    # Filebeat will choose the paths depending on your OS.
    var.paths: ["/var/log/messages","/var/log/dnf.rpm.log","/var/log/dnf.log","/var/log/boot.log","/var/log/maillog"]

  # Authorization logs
  auth:
    enabled: true

    # Set custom paths for the log files. If left empty,
    # Filebeat will choose the paths depending on your OS.
    var.paths: ["/var/log/secure"]
You can do the same for other modules.
- Configure Filebeat 8.x Output;
You can configure Filebeat to send logs to various log processing endpoints. In most cases, this can be Elasticsearch or Logstash.
To configure Elasticsearch/Logstash output, ensure that the Elastisearch/Logstash system is reachable from the system where Filebeat is installed;
Example output configuration;
output.elasticsearch:
  hosts: ["localhost:9200"]
With ELK Stack 8.x, Elasticsearch requires authentication and the connection protocol should be HTTPS.
So you need to define the credentials. In our setup, we are using the default Elastic user credentials. You should probably create a different user on Kibana and assign the correct permissions to write to an index.
For Filebeat Running on the same Server as Elasticsearch;
# ---------------------------- Elasticsearch Output ----------------------------
output.elasticsearch:
  # Array of hosts to connect to.
  hosts: ["localhost:9200"]

  # Protocol - either `http` (default) or `https`.
  protocol: "https"
  ssl.certificate_authorities: "/etc/elasticsearch/certs/http_ca.crt"
  # Authentication credentials - either API key or username/password.
  #api_key: "id:api_key"
  username: "elastic"
  password: "tf6gm-UfcWVuPoP3pU5M"
For Filebeat running on a remote host;
# ---------------------------- Elasticsearch Output ----------------------------
output.elasticsearch:
  # Array of hosts to connect to.
  hosts: ["192.168.58.43:9200"]

  # Protocol - either `http` (default) or `https`.
  protocol: "https"
  ssl.certificate_authorities: "/etc/ssl/certs/elasticsearch_ca.pem"
  # Authentication credentials - either API key or username/password.
  #api_key: "id:api_key"
  username: "elastic"
  password: "tf6gm-UfcWVuPoP3pU5M"
Download Elasticsearch CA certificate and install it on the path defined by the line ssl.certificate_authorities:. The Elasticsearch certificate can be downloaded using the command below;
openssl s_client -connect <ELASTIC IP>:9200 -showcerts < /dev/null | openssl x509 -text | sed -ne '/-BEGIN CERTIFICATE-/,/-END CERTIFICATE-/p'Copy the certificate and paste it in the certificate file defined.
Test the Filebeat Output;
filebeat test outputelasticsearch: https://192.168.58.43:9200...
parse url... OK
connection...
parse host... OK
dns lookup... OK
addresses: 192.168.58.43
dial up... OK
TLS...
security... WARN server's certificate chain verification is disabled
handshake... OK
TLS version: TLSv1.3
dial up... OK
talk to server... OK
version: 8.1.2
You can define the credentials in plain text as shown above or define the credentials in Filebeat keystore to avoid the use of plain text.
To store the credentials in the Filebeat keystore;
filebeat keystore createYou can either add the user or password to the keystore. Will only add the password in this setup. NOTE the variable used for password/username should merge in the keystore and on the configuration file.
filebeat keystore add PASSPress enter and type your password to store in a variable called PASS in the keystore.
Next, update the details on the configuration file.
Instead of;
  username: "elastic"
  password: "tf6gm-UfcWVuPoP3pU5M"
Use;
  username: "elastic"
  password: "${PASS}"
Save and exit the file and test output.
If you are using Logstash as output, comment all Elasticsearch output configs and configure Logstash;
# ------------------------------ Logstash Output -------------------------------
output.logstash:
  # The Logstash hosts
  hosts: ["LOGSTASH-IP:5044"]
...
If logstash is using SSL/TLS, ensure you do appropriate configs as well.
- Configure Filebeat logging to avoid sending Filebeat logs to syslog, usually /var/log/messages on RHEL/CentOS systems.
vim /etc/filebeat/filebeat.ymlAdd the lines below;
logging.level: info
logging.to_files: true
logging.files:
  path: /var/log/filebeat
  name: filebeat
  keepfiles: 5
  permissions: 0644
- Test Filebeat configuration for any errors;
filebeat test configIf there is no issue, output should be Config OK.
- Next start and enable Filebeat using the command below.
You can run Filebeat in standard out/err before you can ran as a service to confirm connection to the endpoint;
filebeat -eIf you see a message like;
"message":"Connection to backoff(elasticsearch(https://192.168.58.43:9200)) established","service.name":"filebeat","ecs.version":"1.6.0"}Then you are good to start the service;
systemctl enable --now filebeatCheck the status;
systemctl status filebeatSample output
● filebeat.service - Filebeat sends log files to Logstash or directly to Elasticsearch.
   Loaded: loaded (/usr/lib/systemd/system/filebeat.service; enabled; vendor preset: disabled)
   Active: active (running) since Mon 2022-04-11 20:57:25 EAT; 2min 18s ago
     Docs: https://www.elastic.co/beats/filebeat
 Main PID: 5852 (filebeat)
    Tasks: 8 (limit: 11388)
   Memory: 102.5M
   CGroup: /system.slice/filebeat.service
           └─5852 /usr/share/filebeat/bin/filebeat --environment systemd -c /etc/filebeat/filebeat.yml --path.home /usr/share/filebeat --path.config /etc/filebeat --path.d>

Apr 11 20:57:25 rocky8 systemd[1]: filebeat.service: Succeeded.
Apr 11 20:57:25 rocky8 systemd[1]: Stopped Filebeat sends log files to Logstash or directly to Elasticsearch..
Apr 11 20:57:25 rocky8 systemd[1]: Started Filebeat sends log files to Logstash or directly to Elasticsearch..
Verifying Filebeat Events on Kibana
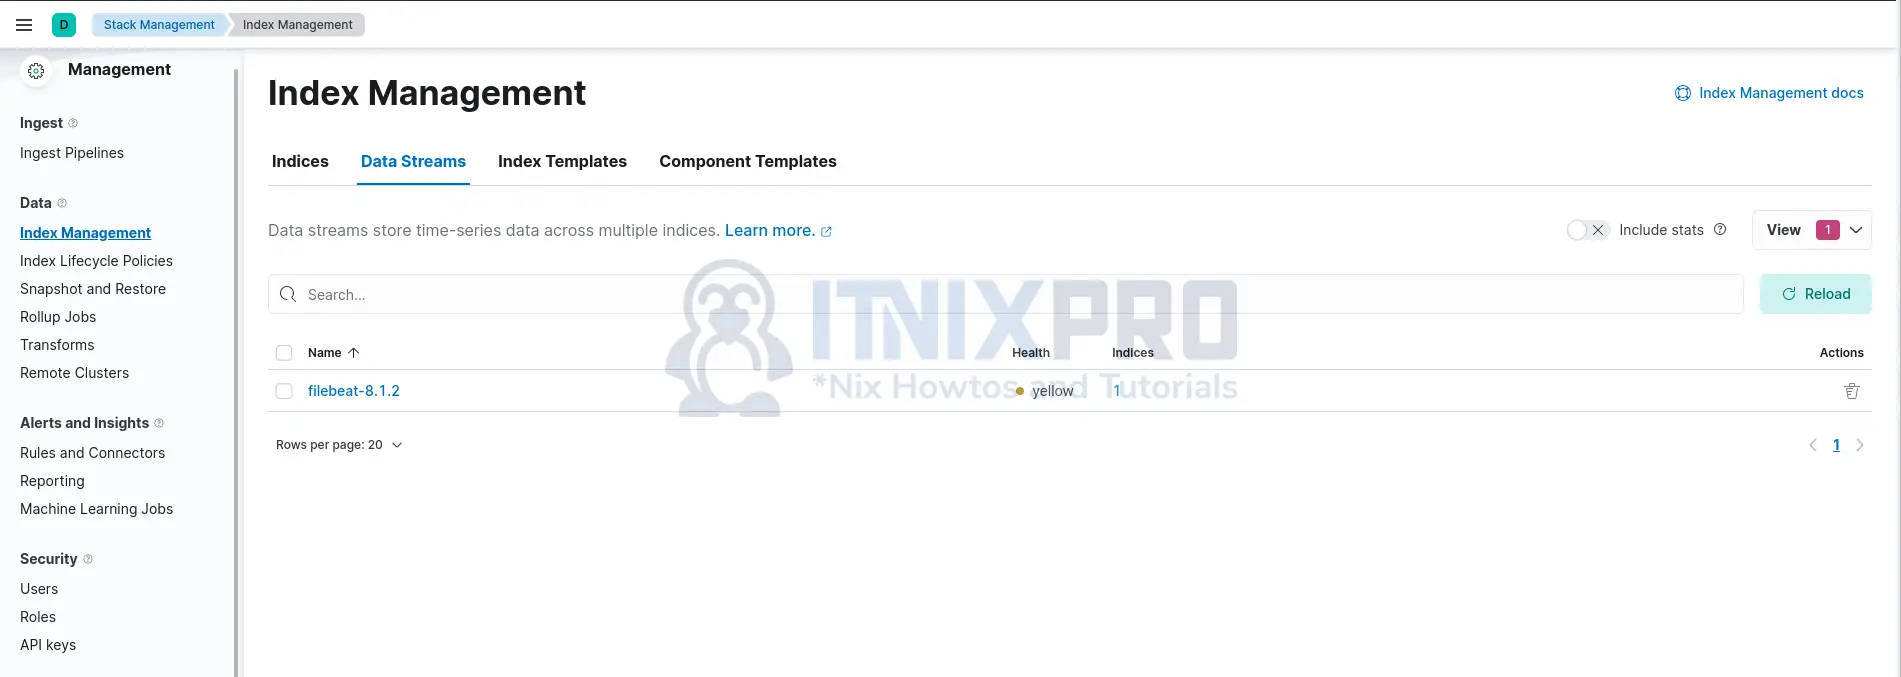
If you are sending logs to Elasticsearch directly, Filebeat will by default create a data stream called filebeat-*.
So login to Kibana and go to Management > Stack Management > Data > Index Management (Data streams/indices/index templates) to confirm available data streams.
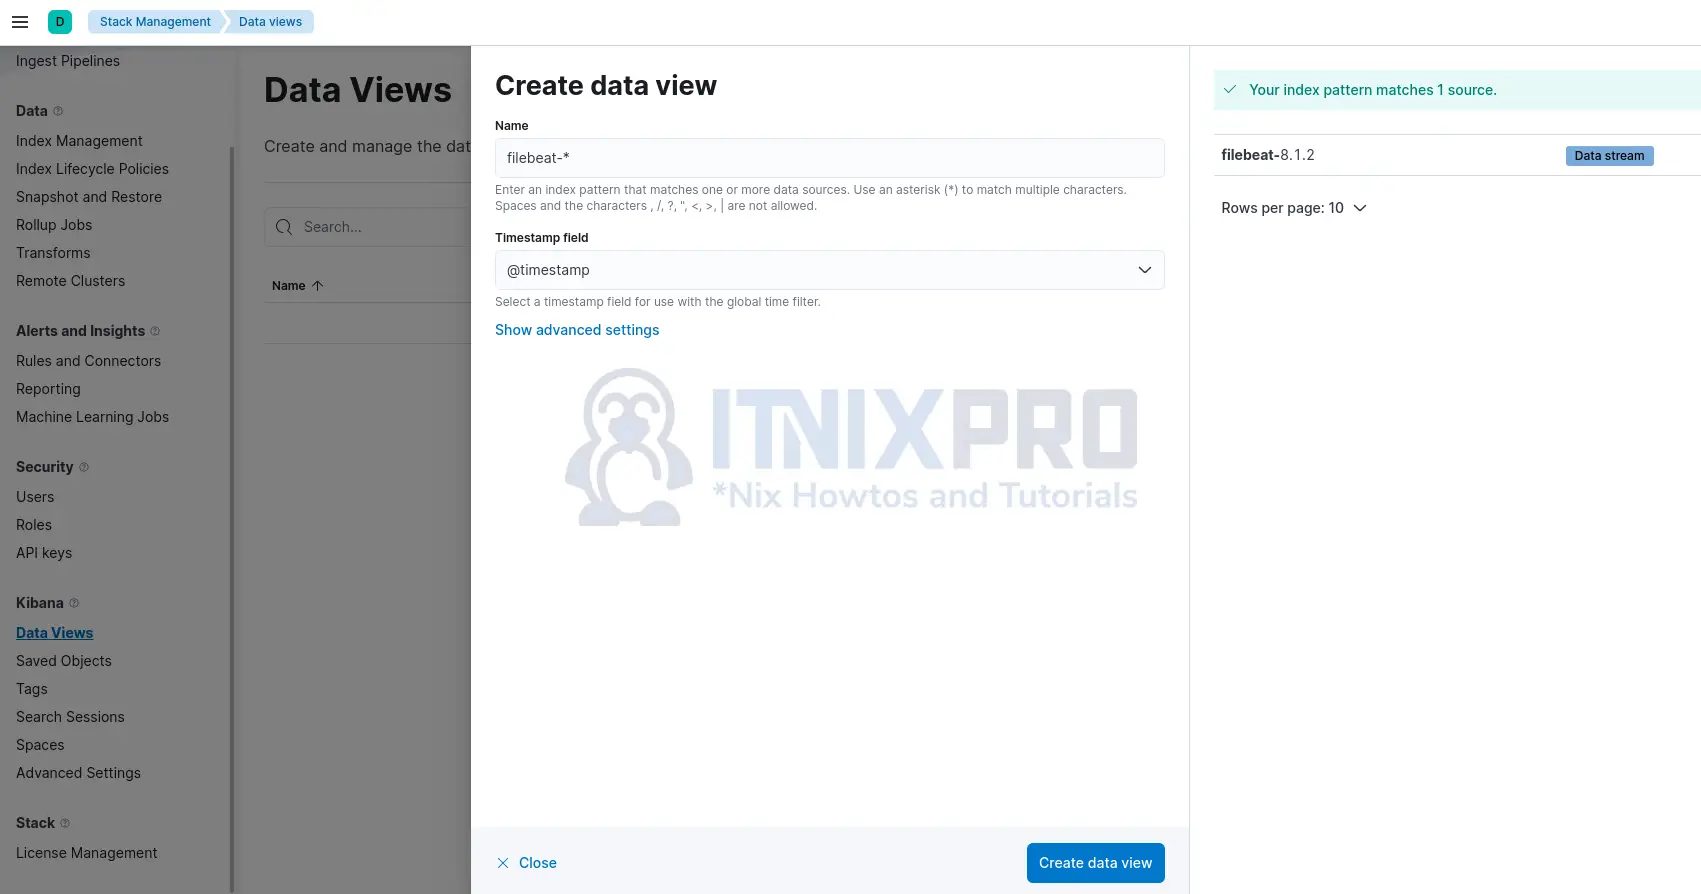
Create Kibana Data Views based on the data stream/index by navigating to Management > Stack Management > Kibana > Data Views. Click Create Data Views > Create Data Views.
Set the name of the index pattern and timestamp field.
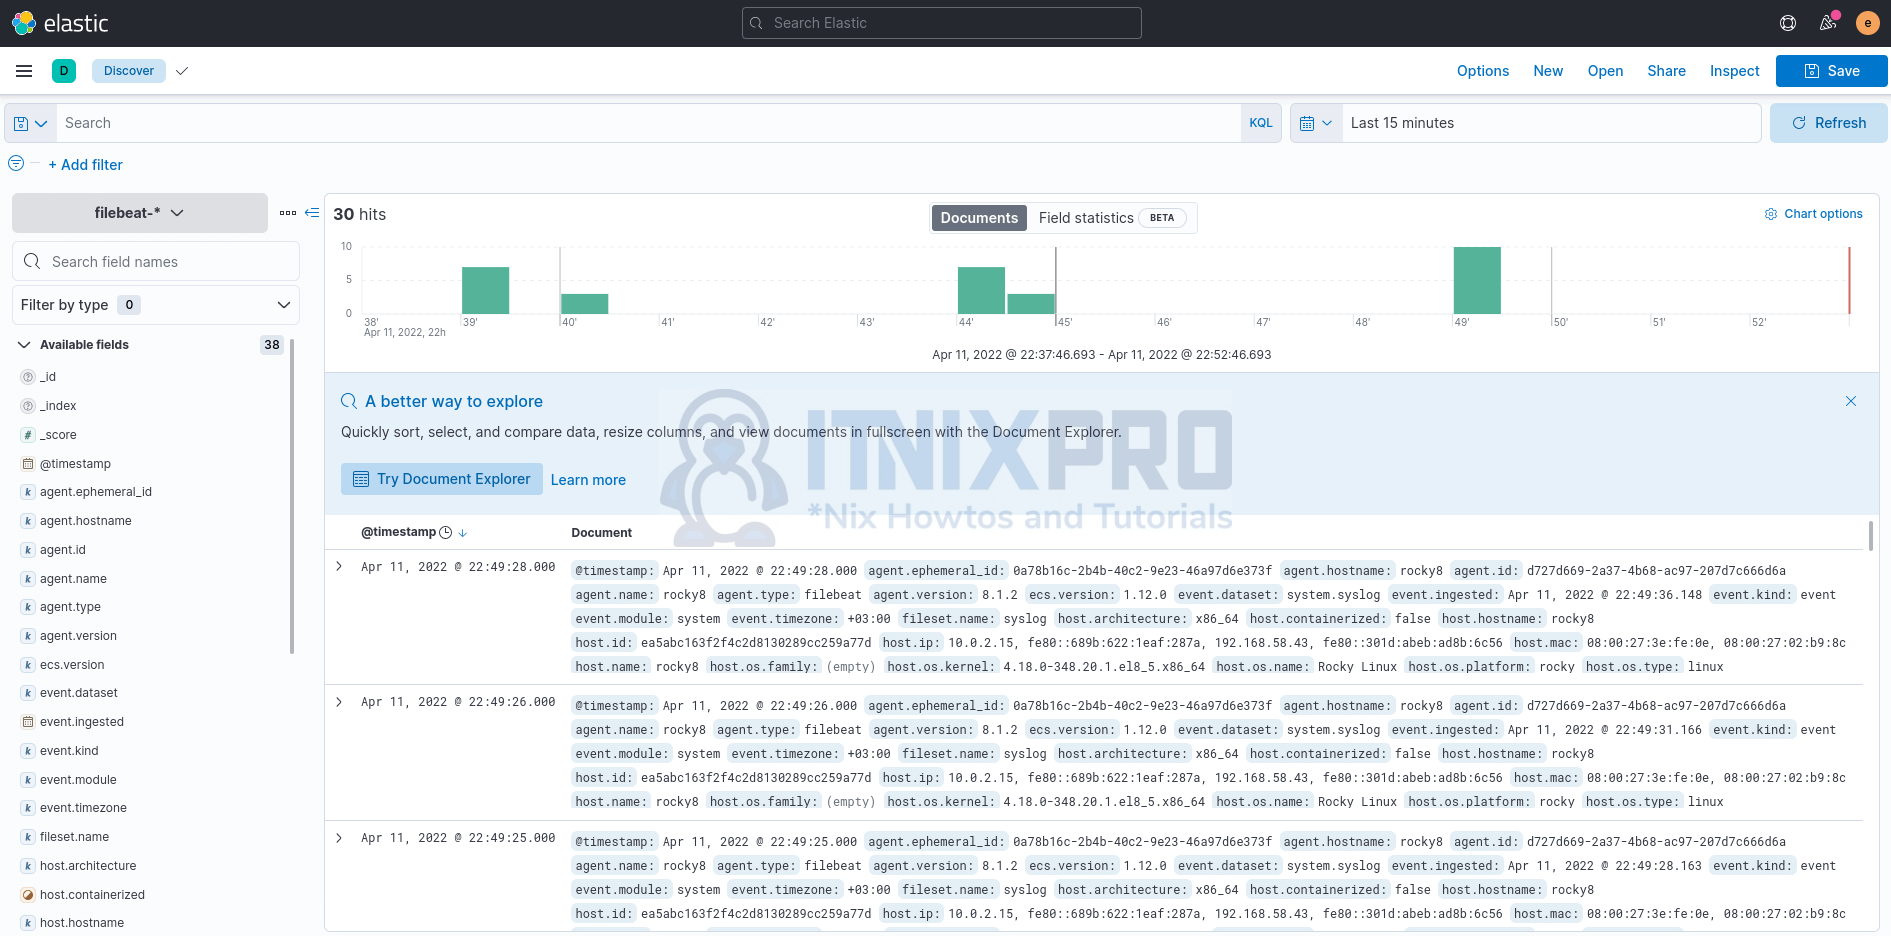
You can now view the data shipped by Filebeat and written to filebeat-* index on Kibana discover;
Congratulations, you’ve made it to the end of the article. You now know how to install Filebeat 8 on a Rocky Linux system.
Read more on Filebeat Documentation
Other Tutorials
Monitor Linux host metrics using Prometheus node exporter
Monitor Windows system metrics using Prometheus node exporter