
This tutorial is going to take you through on how to Monitor Windows system metrics using Prometheus node exporter. Node Exporter is a Prometheus exporter for server and OS level metrics with configurable metric collectors. It lets us keep track of things like RAM, storage space, and CPU utilization. Node exporter is a useful tool for gathering and monitoring all metrics and statistics associated with the operating system.
How to Monitor Windows system metrics using Prometheus node exporter
To utilize the Prometheus Node Exporter, you must first have a Prometheus Server installed and running. Check out our article on how to Install Prometheus on Ubuntu 22.04.
Install Node Exporter on Windows system
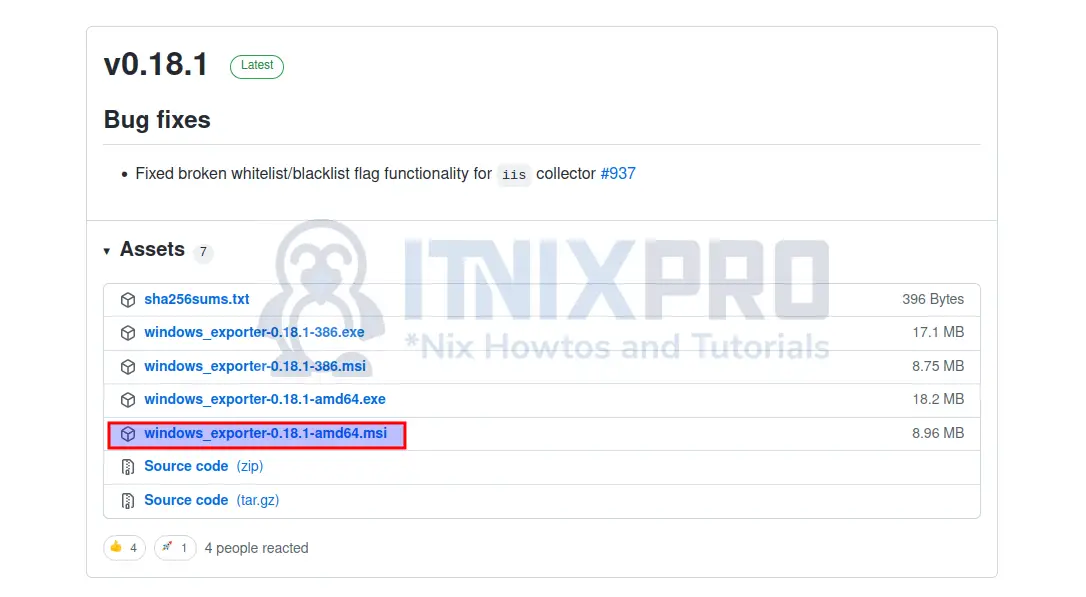
- On your windows operating system, download Node exporter for windows from here and install it.
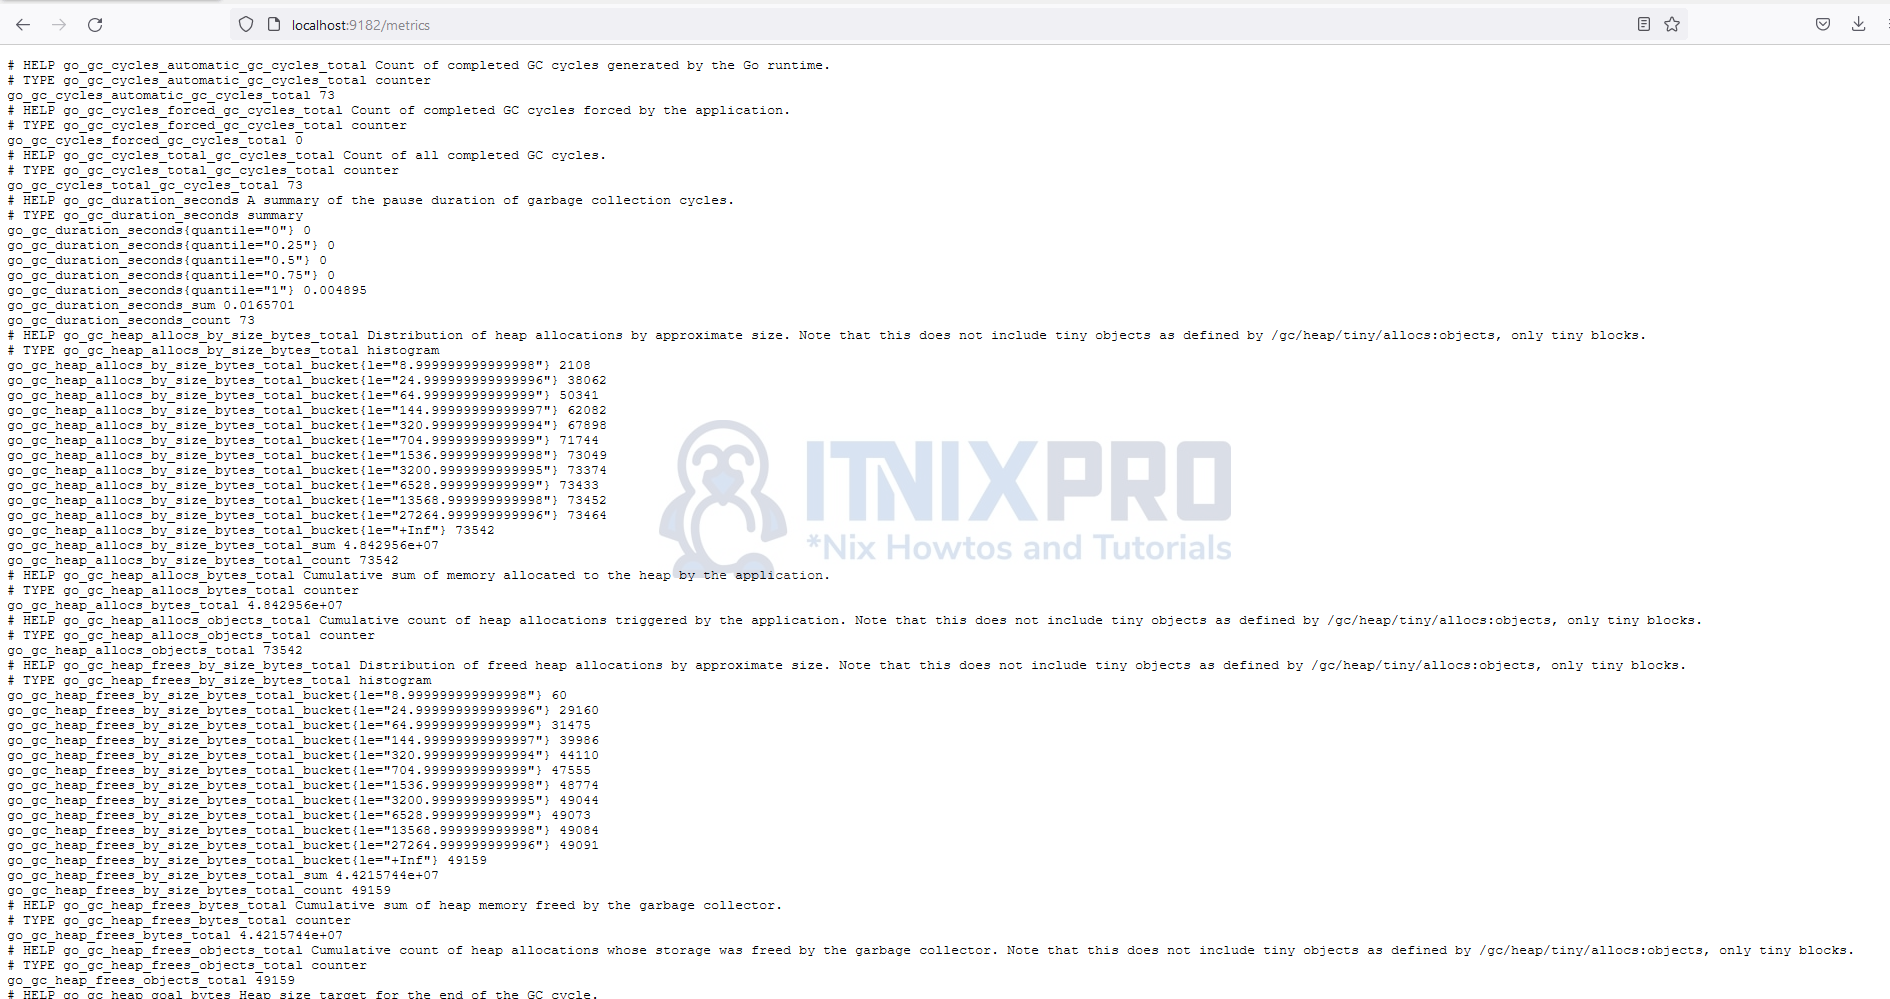
- After installing, node exporter should be running on port 9182. Fire up your favorite browser on your windows and open the following URL
localhost:9182/metrics. If everything goes well you should see the window below.
Add Windows Exporter to Prometheus
- Start by getting your windows IP. To know your windows IP open CMD and type the following command.
ipconfig- Then on your Linux system open Prometheus config file.
sudo nano /etc/prometheus/prometheus.yml- Add the following config at the end of the file, save and close.
 - job_name: "WMI Exporter"

    # metrics_path defaults to '/metrics'
    # scheme defaults to 'http'.

    static_configs:
      - targets: ["YOUR-WINDOWS-IP:9182"]
- Restart the prometheus systemd service using the command below for the changes to take effect.
sudo systemctl restart prometheus.service- Confirm Prometheus is running.
sudo systemctl status prometheusSample output
● prometheus.service - Prometheus
     Loaded: loaded (/etc/systemd/system/prometheus.s>
     Active: active (running) since Mon 2022-03-07 18>
       Docs: https://prometheus.io/docs/introduction/>
   Main PID: 38909 (prometheus)
      Tasks: 8 (limit: 4588)
     Memory: 77.3M
     CGroup: /system.slice/prometheus.service
             └─38909 /usr/local/bin/prometheus --conf>

Mar 07 18:42:14 chat.itnixpro.com prometheus[38909]: >
Mar 07 18:42:14 chat.itnixpro.com prometheus[38909]: >
Mar 07 18:42:14 chat.itnixpro.com prometheus[38909]: >
Mar 07 18:42:14 chat.itnixpro.com prometheus[38909]: >
Mar 07 18:42:14 chat.itnixpro.com prometheus[38909]: >
Mar 07 18:42:14 chat.itnixpro.com prometheus[38909]: >
Mar 07 18:42:14 chat.itnixpro.com prometheus[38909]: >
Mar 07 18:42:14 chat.itnixpro.com prometheus[38909]: >
Mar 07 18:42:14 chat.itnixpro.com prometheus[38909]: >
Mar 07 18:42:14 chat.itnixpro.com prometheus[38909]: >
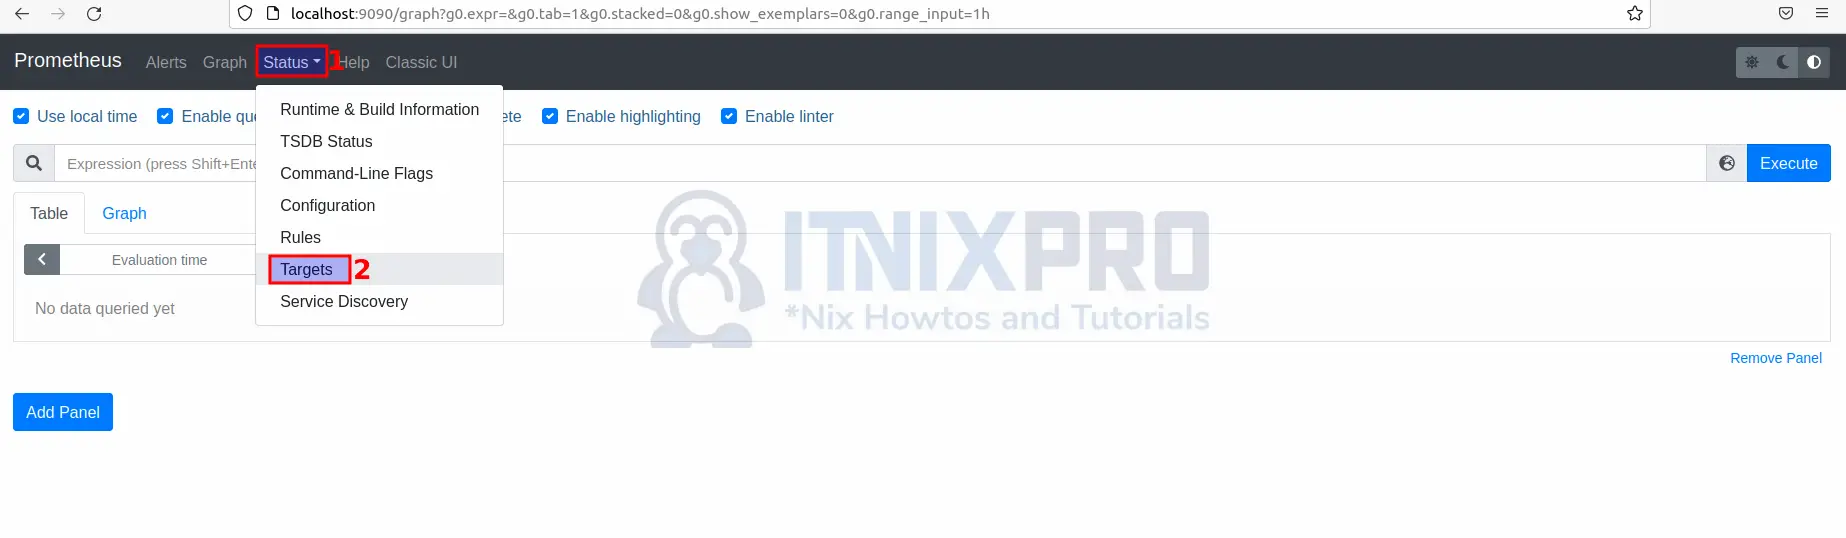
- You can now check node exporter status on Prometheus by clicking on Status then Targets as shown below.
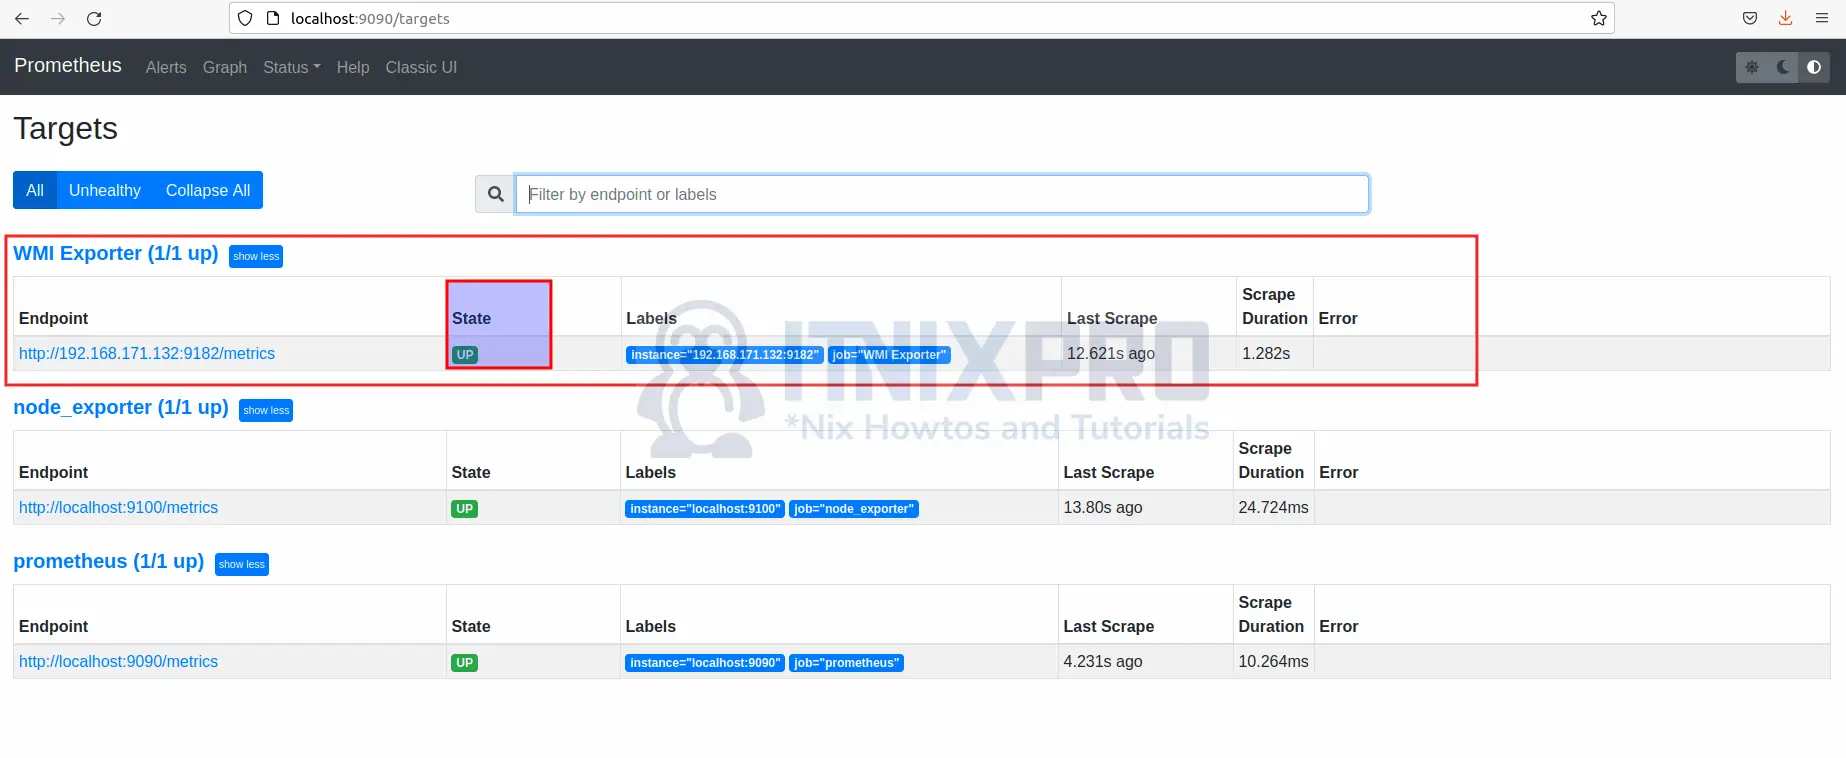
- Windows Node exporter should be UP as shown below.
Monitoring Windows with Prometheus
- On your browser and navigate to
localhost:9090/graphorserver-IP:9090/graphthen on the search bar type windows, a list of windows exporter metrics will appear as shown below.
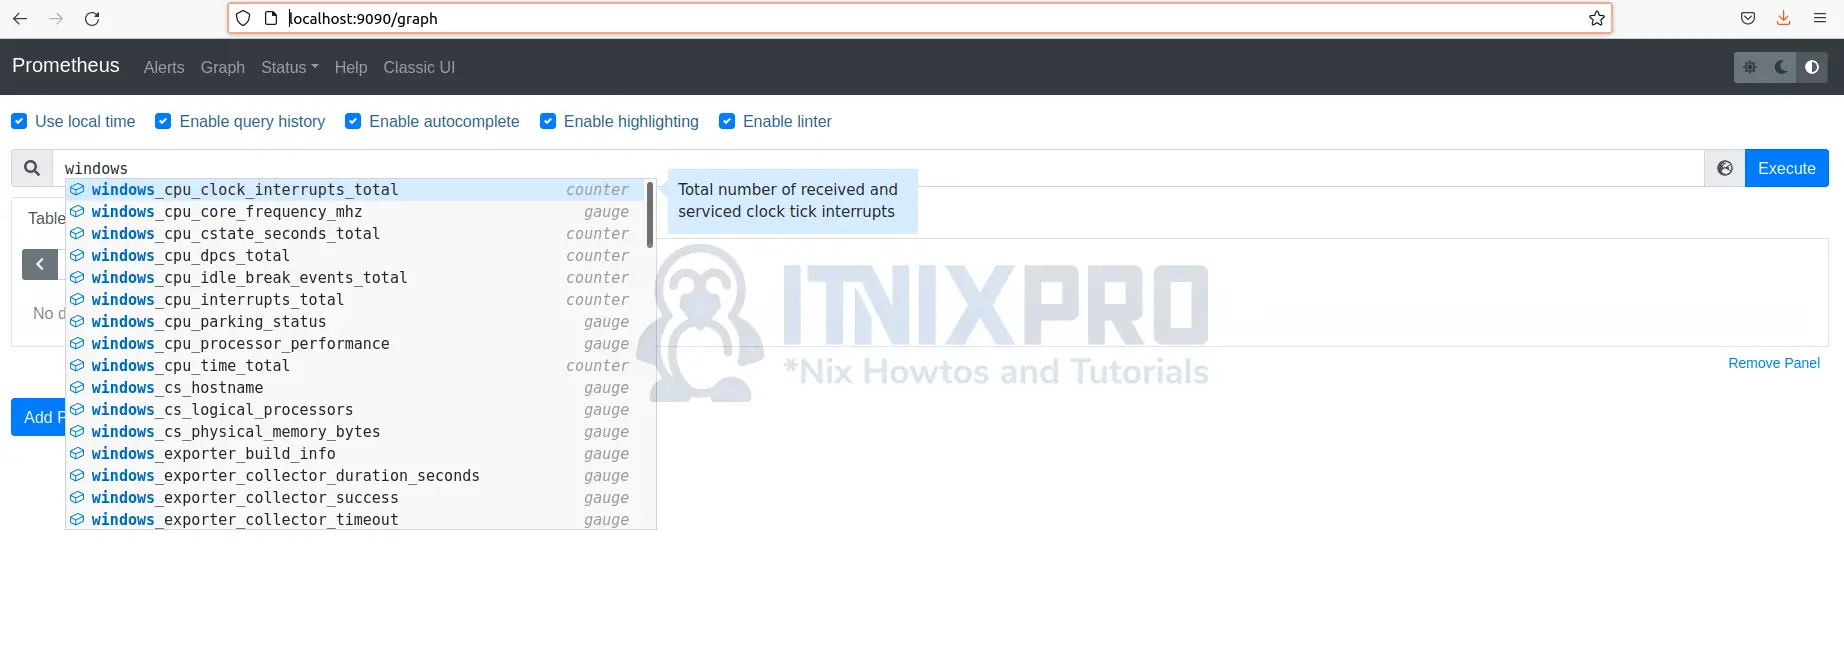
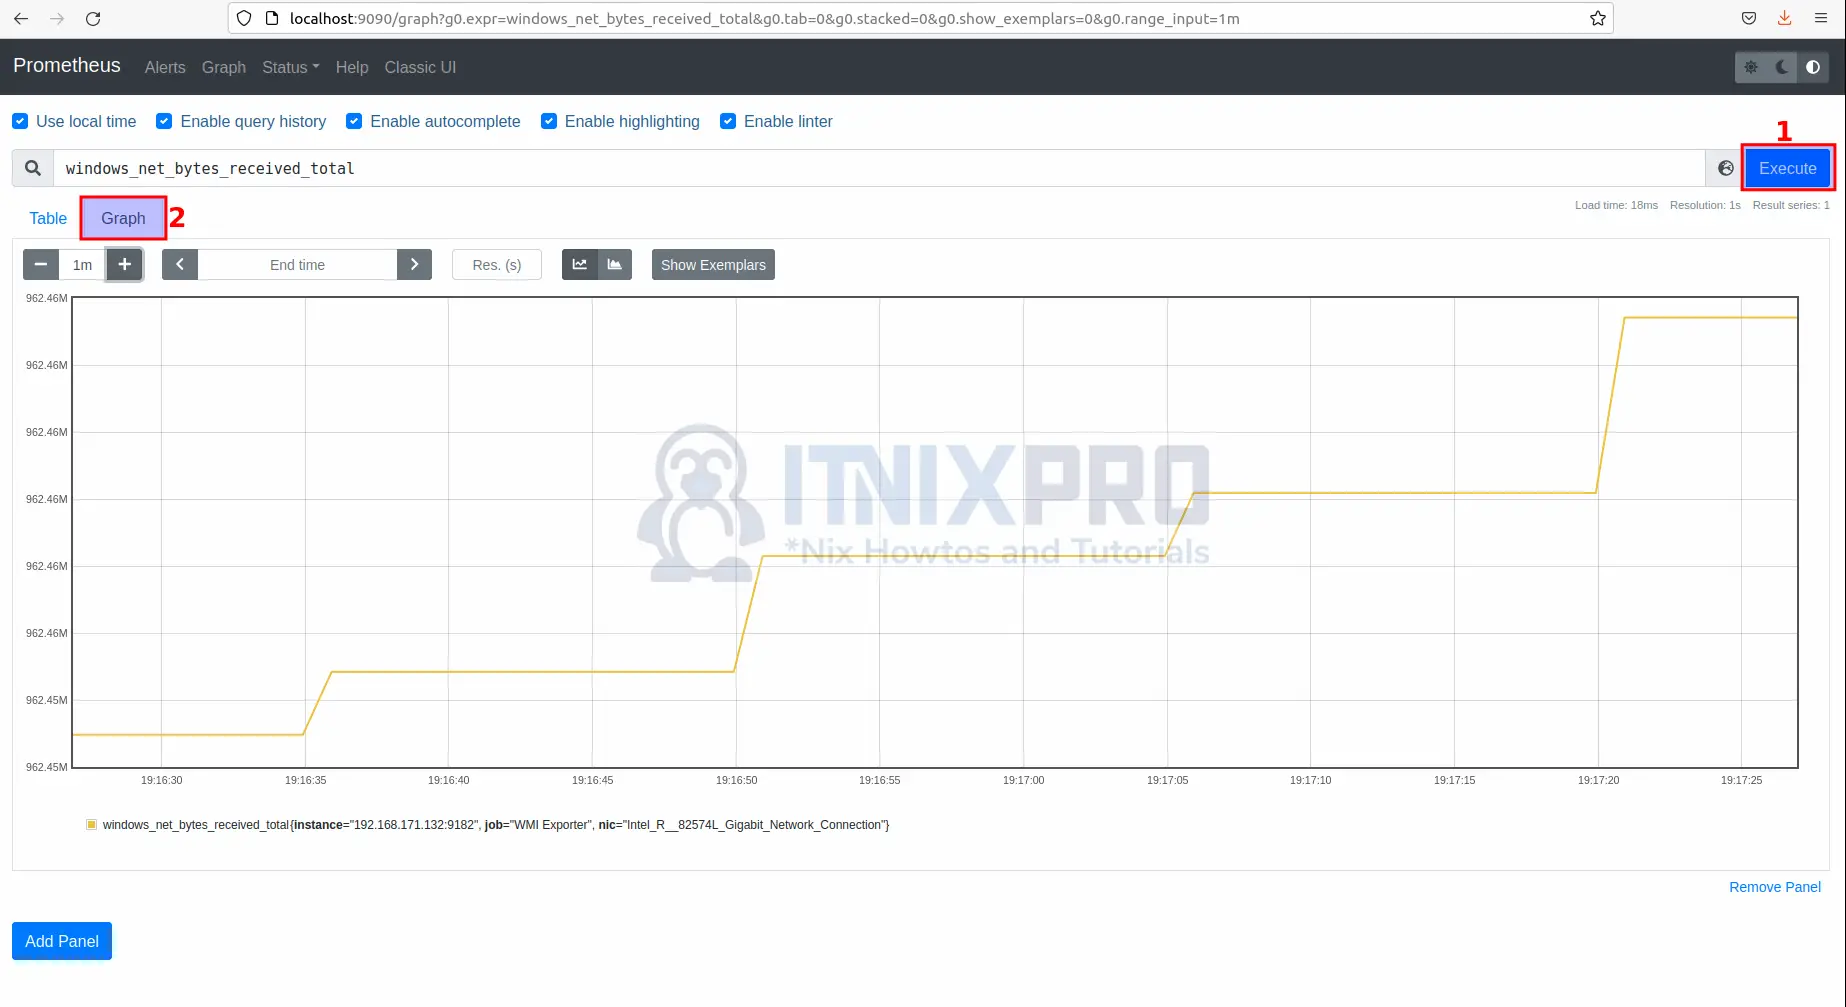
- Scroll on the metrics and select any that you want to monitor.
- Click the Execute button then Graph tab to visualize.
- You have reached the end of the article, Congratulations. You have learned how to Monitor Windows system metrics using Prometheus node exporter.
Read more about Monitoring using Prometheus.
Other Tutorials
Integrate Prometheus with Grafana for Monitoring