
This article is going to take you through on how to monitor Linux host metrics using Prometheus node exporter. Node Exporter is a Prometheus exporter with configurable metric collectors for server and OS level metrics. It allows us to monitor various server resources such as RAM, disk space, and CPU usage. Node exporter is a good tool for collecting all of the metrics and statistics linked to Linux servers for monitoring.
How to Monitor Linux host metrics using Prometheus node exporter
To utilize the Prometheus Node Exporter, you must first have a Prometheus Server installed and running. Check out our article on how to Install Prometheus on Ubuntu 22.04.
Install Node Exporter
- Navigate to official node exporter page and check for latest version under node_exporter.
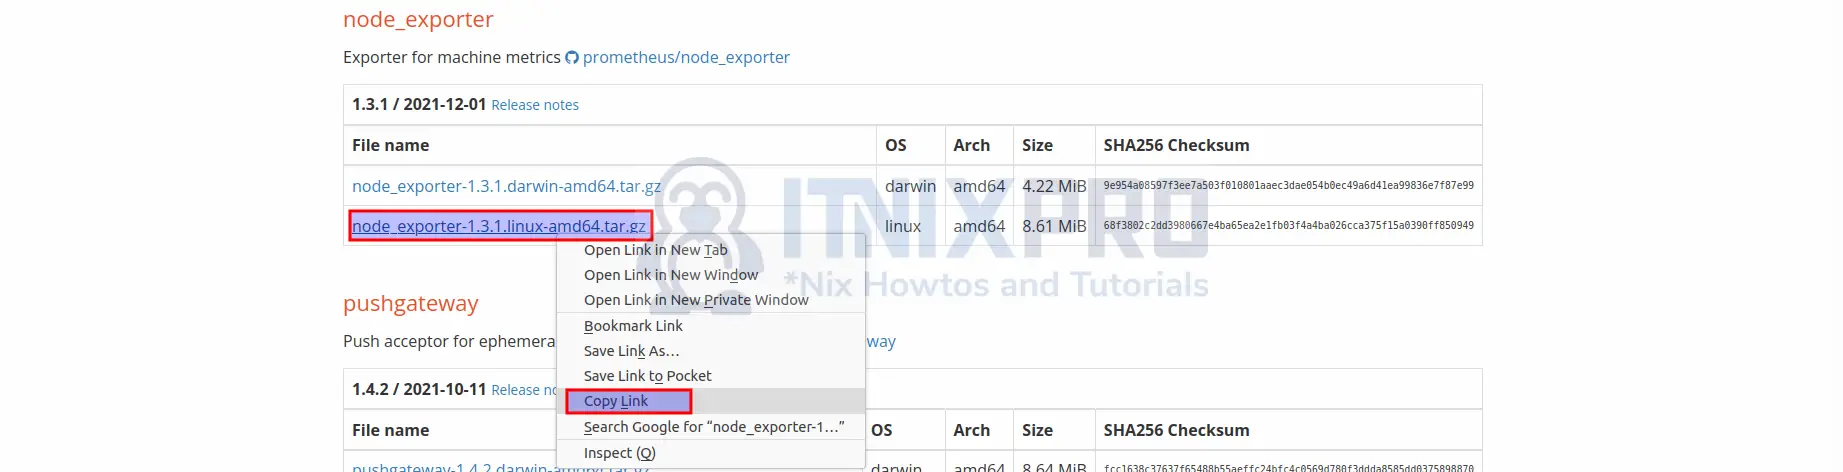
- Use
wgetcommand to download the node exporter.
wget https://github.com/prometheus/node_exporter/releases/download/v1.3.1/node_exporter-1.3.1.linux-amd64.tar.gz- Next use the tar command to extract it after downloading.
tar -xvzf node_exporter-1.3.1.linux-amd64.tar.gz- Then copy the node exporter binary file to the /usr/local/bin directory.
cp node_exporter-1.3.1.linux-amd64/node_exporter /usr/local/bin/Create node exporter user
- Using the following command, create a node exporter user to run the node exporter service.
sudo useradd -rs /bin/false node_exporter- Under systemd, create a node exporter service file using the command below.
sudo nano /etc/systemd/system/node_exporter.servicePaste the following in the file, save and close it.
[Unit]
Description=Node Exporter
After=network.target

[Service]
User=node_exporter
Group=node_exporter
Type=simple
ExecStart=/usr/local/bin/node_exporter

[Install]
WantedBy=multi-user.target
Start Node Exporter Service
- Start by reloading the system daemon using the following command.
sudo systemctl daemon-reload- The start node exporter service.
sudo systemctl start node_exporter- If everything went well, node exporter should be running. Check status using the command below.
sudo systemctl status node_exporterSample output
● node_exporter.service - Node Exporter
     Loaded: loaded (/etc/systemd/system/node_export>
     Active: active (running) since Mon 2022-03-07 1>
   Main PID: 33164 (node_exporter)
      Tasks: 4 (limit: 4588)
     Memory: 2.3M
     CGroup: /system.slice/node_exporter.service
             └─33164 /usr/local/bin/node_exporter

Mar 07 12:22:28 chat.itnixpro.com node_exporter[3316>
Mar 07 12:22:28 chat.itnixpro.com node_exporter[3316>
Mar 07 12:22:28 chat.itnixpro.com node_exporter[3316>
Mar 07 12:22:28 chat.itnixpro.com node_exporter[3316>
Mar 07 12:22:28 chat.itnixpro.com node_exporter[3316>
Mar 07 12:22:28 chat.itnixpro.com node_exporter[3316>
Mar 07 12:22:28 chat.itnixpro.com node_exporter[3316>
Mar 07 12:22:28 chat.itnixpro.com node_exporter[3316>
Mar 07 12:22:28 chat.itnixpro.com node_exporter[3316>
Mar 07 12:22:28 chat.itnixpro.com node_exporter[3316>
- Enable node exporter using the command below so as to be running on system start up.
sudo systemctl enable node_exporter- To check which node exporter version you are running use the following command.
node_exporter --version- By default node exporter listens on port 9100, you can confirm that by using the command below.
sudo netstat -nltp |grep node_exporter- Node exporter should now be exporting metrics, own your favorite web browser navigate to your server URL followed by port 9100 to confirm e.g.
server-IP:9100/metricsorlocalhost:9100/metrics
Configure your Prometheus instances
- Open the prometheus.yml file.
sudo nano /etc/prometheus/prometheus.yml- At the end of the file add the following configurations then save and close.
- job_name: "node_exporter"
        static_configs:
          - targets: ["localhost:9100"]
It should like the file below.
scrape_configs:
  # The job name is added as a label job=>
  - job_name: "prometheus"

    # metrics_path defaults to '/metrics'
    # scheme defaults to 'http'.

    static_configs:
      - targets: ["localhost:9090"]
  - job_name: "node_exporter"

    # metrics_path defaults to '/metrics'
    # scheme defaults to 'http'.

    static_configs:
      - targets: ["localhost:9100"]
- For the configuration changes to take effect, restart the Prometheus service using the following command.
sudo systemctl restart prometheus- You can now check node exporter status by opening Prometheus and clicking on Status then Targets as shown below.
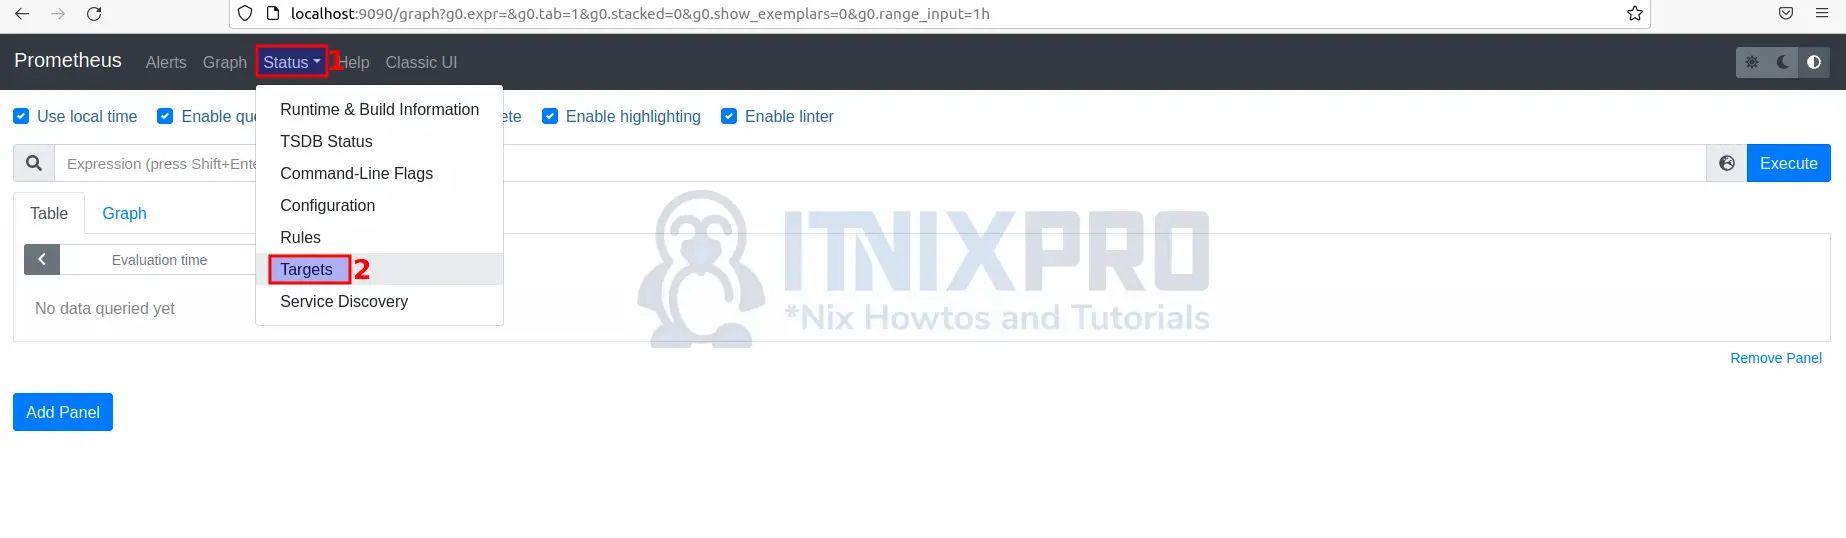
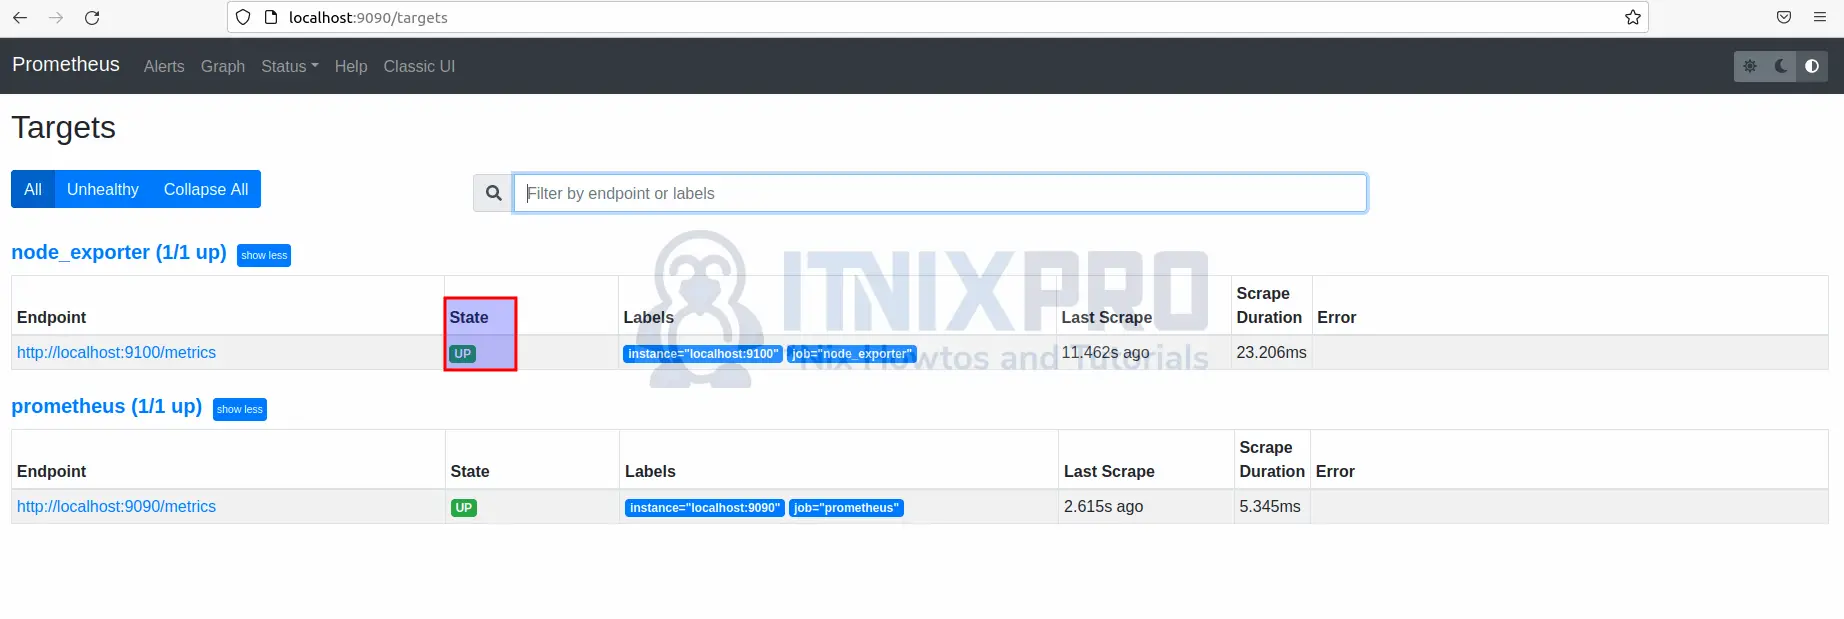
- Node exporter should be UP as shown below.
Monitoring Linux with Prometheus
- On your browser and navigate to
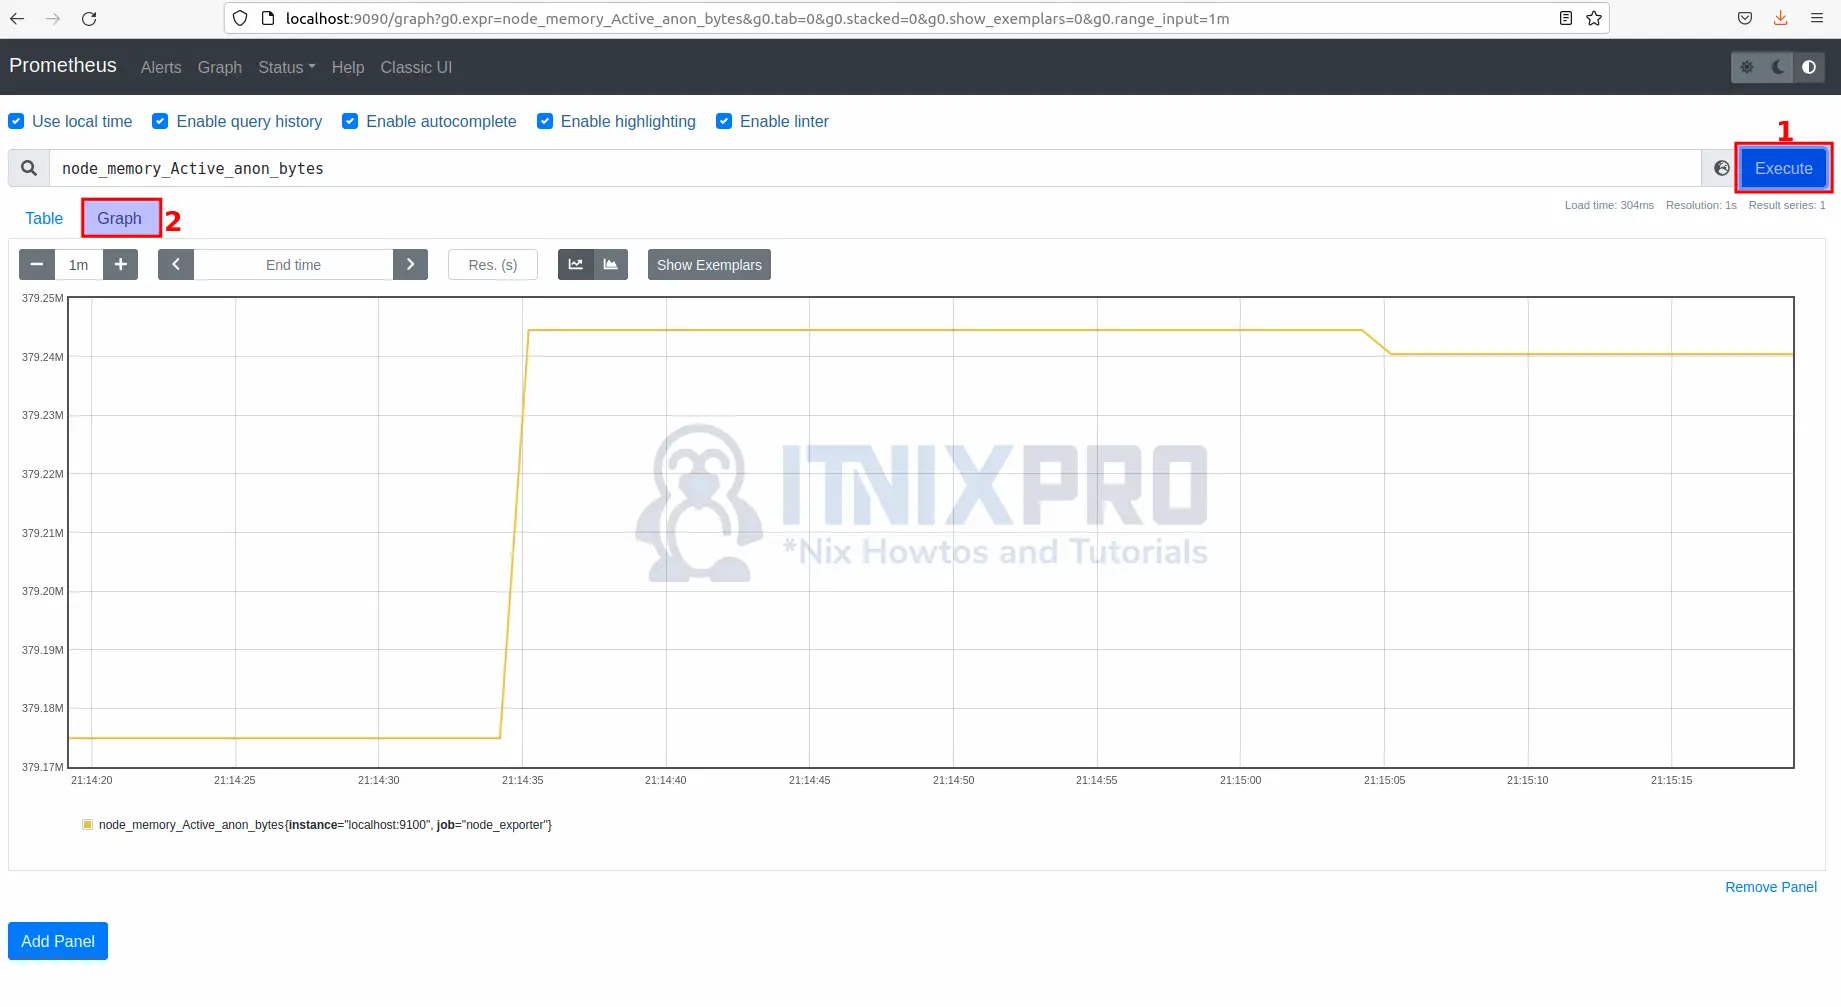
localhost:9090/graphorserver-IP:9090/graphand then on the search bar type node, a list of node exporter metrics will appear as shown below.
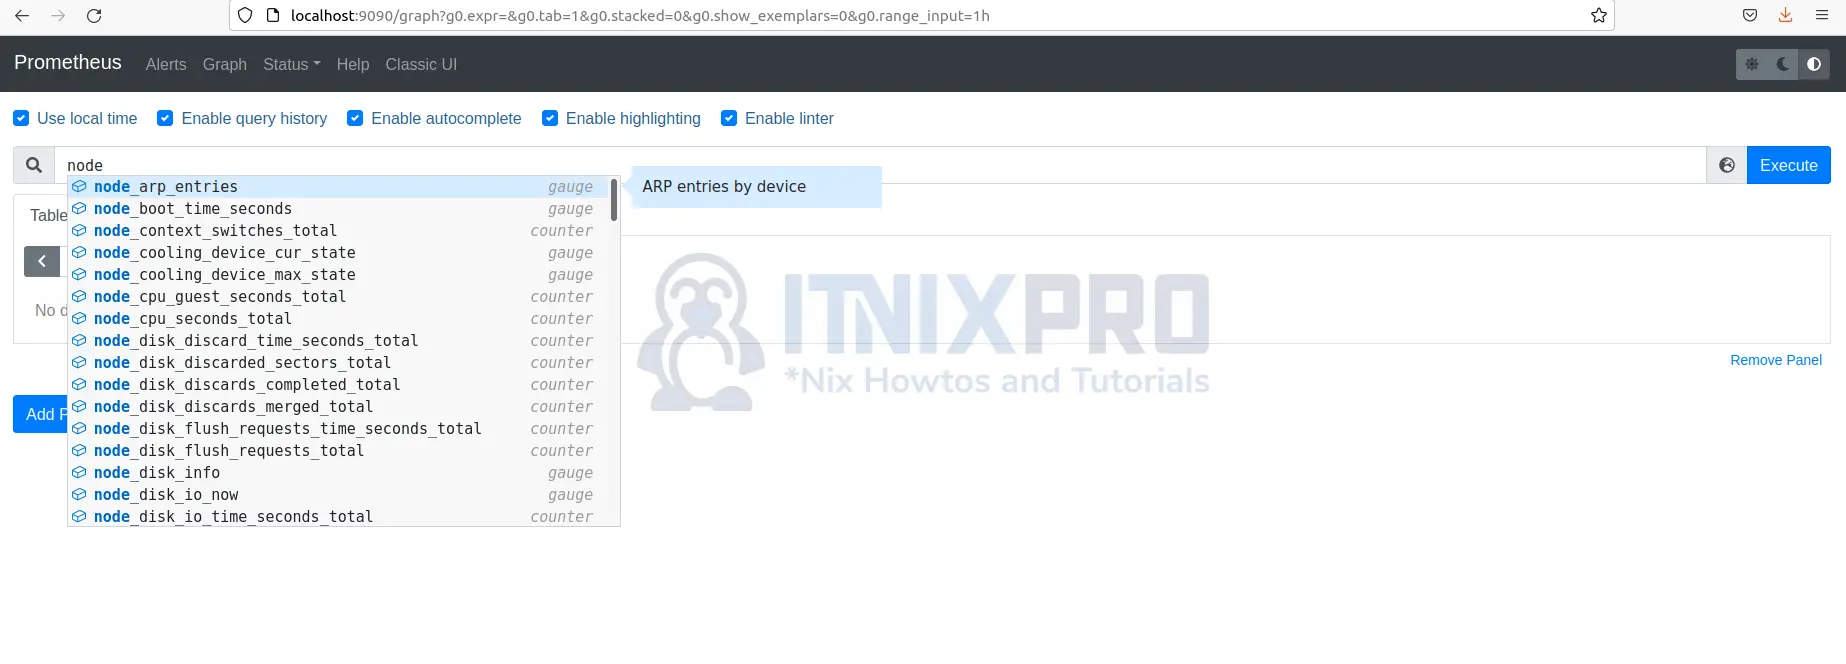
- Select any metrics that you want to monitor from the list.
- Click the Execute button then Graph tap to visualize.
- You have reached the end of the article, Congratulations. You have learned how to Monitor Linux host metrics using Prometheus node exporter.
Read more about node exporter.
Other Tutorials
Integrate Prometheus with Grafana for Monitoring